
Organizing the “Big Tent” of the Museum Field

Imagine taking a road trip to visit Independence Hall. It would be impossible to get there if you don’t know where you are (are you starting in Boston? Chicago? Los Angeles?). Yet most museums and historic sites find themselves in this same predicament—but they don’t know it.
Knowing your museum’s financial position within its larger context can more clearly improve performance. We’ve witnessed how demographic shifts, a global pandemic, and social issues have affected all museums in the last year. Identifying which museums are responding well or poorly is largely based on rumor and anecdote, resulting in an incomplete picture of the field—and potentially misleading if a museum bases its decisions on them. Instead, we are following the advice of Karen Berman and Joe Knight, authors of Financial Intelligence (2013): “The art of accounting and finance is the art of using limited data to come as close as possible to an accurate description of how well a company is performing.”

Thanks to the availability of financial data from the Urban Institute’s National Center for Charitable Statistics (NCCS), Engaging Places will help history museums and historic sites better identify their peers and their position among them. Armed with this information, organizations can do more than benchmark against previous years. Museums will be able to financially position themselves geographically and by museum type. They will be able to evaluate their performance against their financial peers to identify strengths and weaknesses. By understanding their position, they can move forward with greater confidence.
Assisting with this endeavor is Colin Gliniecki, who recently received his master’s degree in Museum Studies at George Washington University and his bachelor’s in both Business and History from Indiana University. He has managed and analyzed development data for the National Society of Colonial Dames of America and has spent time with the National Air and Space Museum, Shedd Aquarium, the Chicago History Museum, Children’s Museum of Indianapolis, the Glenn A. Black Laboratory of Archaeology and is now tackling this national data on museums for Engaging Places.
The American Alliance of Museums takes the “big tent” approach to defining museums: “if an organization considers itself to be a museum, it’s in the tent.” (AAM 2008, 3) The Engaging Places Financial Mapping Project (EPMMP) takes a similar approach, allowing for a wide array of institutions to fall under the umbrella. Allowing so many institutions into this “tent” has its benefits, but it also can create confusion. Without a more detailed understanding of what’s inside the tent, you may be comparing yourself to institutions that don’t have meaningful similarities to you (e.g., local house museum vs. George Washington’s Mount Vernon or “apples vs. oranges”). The unfortunate reality is many boards and staff members rely on inappropriate comparisons (why can’t we be like Colonial Williamsburg or Mount Vernon?), resulting in unreasonable expectations, mission creep, unnecessary risks, and unstable finances. The Financial Mapping Project will help museums make better decisions during planning and evaluation, and ultimately increase their sustainability and impact.
To begin our “apples vs. apples” analysis of museums, we rely on how organizations are identified by the Internal Revenue Service in the Form 990, 990-EZ, or 990-PDF according to National Taxonomy of Exempt Entities (NTEE) codes. For example, art museums are identified as A51 and history museums are A54. Not only do NTEE codes define the museum field according to a national standard, but they also allow us to deconstruct it into subsets of museum types for greater clarity. Although most museums have made their financial data available for years through the Form 990, the data has not been analyzed meaningfully to understand the shapes, trends, and behaviors of the different corners of the field.
The two charts below illustrate how an analysis by NTEE codes can help museums gain a clearer perspective of their peer institutions. Figure 1 shows the composition of the museum field according to type (e.g., art vs history), while Figure 2 displays the field by combined revenue per type (e.g., total revenue for art museums vs history museums). Art Museums (A51 in orange) represent 5 percent of the museum field, yet attract 34 percent of the revenue. By contrast, Historical Organizations (A80 in magenta) and Historical Societies & Historic Preservation (A82 in violet) collectively represent nearly 60 percent of the museum field but only capture 20 percent of total revenue? Is this suggesting history organizations are becoming less financially sustainable? Which museums have successfully broken this national pattern and have managed steady growth?
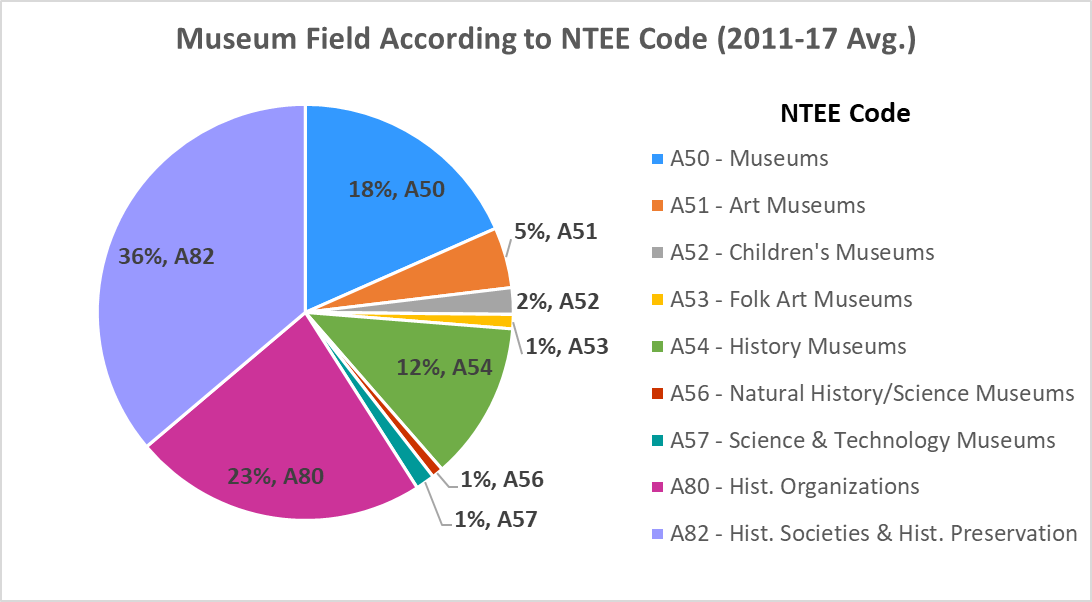
Figure 1. Source: Internal Revenue Services and NCCS
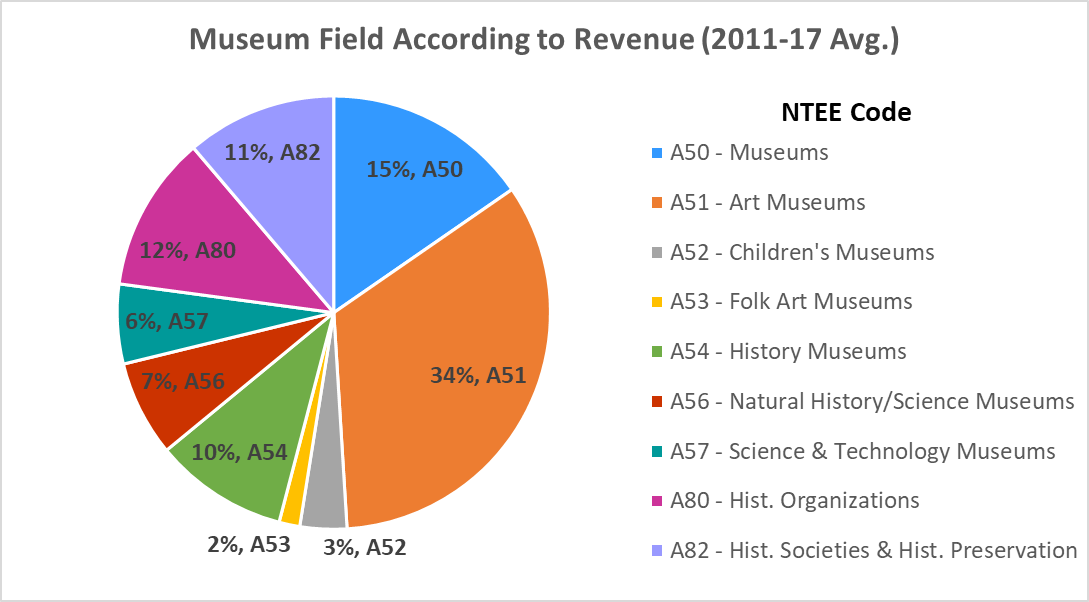
Figure 2. Source: Internal Revenue Services and NCCS
In the coming months, Engaging Places will post a series of articles analyzing museums by type, region, and over time with our recommendations. These articles will investigate what the average institution in these museum types looks like and which direction these museum types look to be heading. For details on our methodology, see Financial Mapping Project. In the meantime, we recommend Understanding Michael Porter: The Essential Guide to Competition and Strategy (2012) by Joan Magretta.
