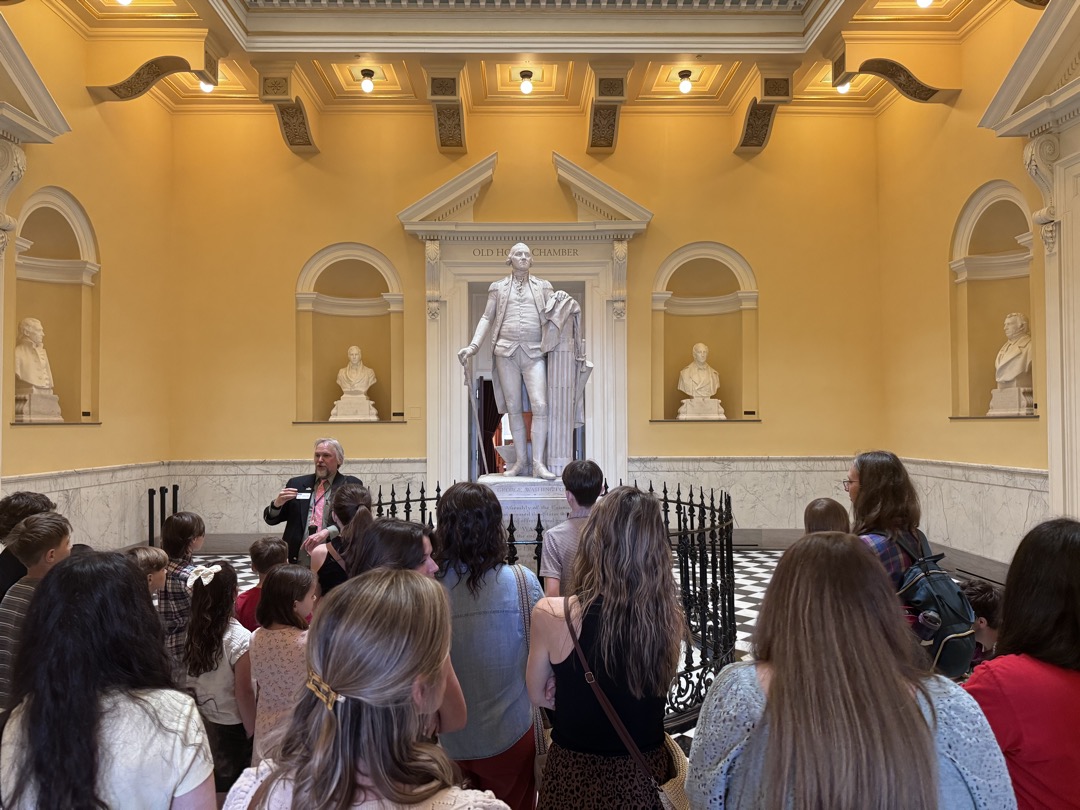
Category Archives: Performance measures

How can History-Focused Organizations Invest in Stability?

Figure 1. History-Focused Organizations command large portions of the museum field’s revenue and institutions. Source: Internal Revenue Services and National Center for Charitable Statistics.

Over the past year, Engaging Places has been looking over individual segments of the museum field. While these segments are unique in specific ways, as demonstrated by the data, several of them do share a common theme and mission: an overall goal to promote history. These four segments are History Museums (A54), History Organizations (A80), Historical Societies & Historic Preservation (A82), as well as the broad Museums (A50) category. By combining these segments we can focus on the history-centric portion of the museum field that makes up close to half of its revenue and consists of a whopping 89% of its institutions (see Figure 1). This block of museums is incredibly dominant within the field and a major focus of Engaging Places’ work. For ease of reference, we will be referring to them as History-Focused Organizations.

It is important to remember that as an aggregate these History-Focused Organizations still trend small. Over 90% operate on less than $1 million in revenue annually, with contributions and grants bringing in over half of that vital revenue. For these smaller museums, financial security is a constant and essential priority. While many of these History-Focused Organizations are unable to achieve large pools of investment to stabilize operations, unlike some of their larger counterparts, they can develop practices to move them in this direction. 

Continue reading

HLI Seminar Returned in New Format, New Season

The Class of 2022 celebrating their graduation from the HLI Seminar.

The History Leadership Institute, AASLH’s professional development program for mid-career history professionals, introduced its long-running Seminar in a new format in June.

In 1959, the Seminar began as an effort to train newly graduated history students and directors of history museums in the unique skills of managing museums, historic sites, and archives in a six-week program held at Colonial Williamsburg, During the decades that followed, the Seminar has continually changed to meet the needs of the field and explore new and emerging practices.

Continue reading

Are Historical Organizations Choosing the Right Heroes?

When your history organization is modeling itself on other museums or historical societies, are you choosing the right ones?  Are they doing things that are well within your capacity or are you following an impossible dream?  There’s nothing wrong with observing the extraordinary leaders in the field, but if you’re modeling your life on a superhero, you may be destined for an avoidable series of crashes and burns.  You would have been much more successful had you devoted your time and energy on more achievable efforts.    

For example, Historical Organizations (NTEE Code A80) are “organizations that promote awareness of and appreciation for history and historical artifacts,” which is mostly composed of local historic sites, house museums, and memorials that are not solely history museums or historical societies.  A sample of Historical Organizations shows that many focus on local history, support museums, or memorialize people, places, or events (see Table 1). Of the 2,500 Historical Organizations providing IRS Forms 990 in 2017, nearly 40 percent include the words “memorial,” “foundation,” “friends,” or “association” in their names.

Continue reading

Nearly 50% of History Museums Operate on Less Than $100,000

A financial review of more than 1,300 History Museums in 2017 reveals that nearly 90 percent operate on less than $1 million annually, and nearly half on less than $100,000 (see Figures 1 and 2). History museums are financially fragile, but an annual increase in revenue of $5,000 to $10,000 could have a tremendous impact on their capacity and impact. How might this be achieved?  Hints of potential solutions are revealed in the changing revenue patterns of larger museums.  

Figure 1. Annual revenue for most history museums was less than $1 million in 2017, the most complete recent data available.  Source: Internal Revenue Service and National Center for Charitable Statistics.
Figure 2. Annual revenue for most History Museums was less than $1 million in 2017, the most complete recent data available.  Source: Internal Revenue Service and National Center for Charitable Statistics.

A closer look shows that most History Museums derive about 60-70 percent of their revenue from “unearned” sources (i.e., contributions, grants, investments, fundraising events, membership dues), but the mix changes according to size.  Museums with less than $10 million in revenue received 4 to 6 percent of their income from investments, which doubled or tripled in the largest museums to 11 percent. While asking for support from people and foundations (i.e., contributions and grants) remained steady, there seems to be increased attention on making money from money (e.g., interest, dividends, sale of securities, drawing funds from endowments). 

Continue reading

Improving Museum Financial Performance

Organizing the “Big Tent” of the Museum Field

Imagine taking a road trip to visit Independence Hall.  It would be impossible to get there if you don’t know where you are (are you starting in Boston? Chicago? Los Angeles?). Yet most museums and historic sites find themselves in this same predicament—but they don’t know it.  

Knowing your museum’s financial position within its larger context can more clearly improve performance.  We’ve witnessed how demographic shifts, a global pandemic, and social issues have affected all museums in the last year.  Identifying which museums are responding well or poorly is largely based on rumor and anecdote, resulting in an incomplete picture of the field—and potentially misleading if a museum bases its decisions on them. Instead, we are following the advice of Karen Berman and Joe Knight, authors of Financial Intelligence (2013): “The art of accounting and finance is the art of using limited data to come as close as possible to an accurate description of how well a company is performing.”

Continue reading

Who Knows How COVID Affected History Organizations? AASLH Will With Your Help.

Photo by Sora Shimazaki from Pexels

Visitation at history organizations was flat from 2018 to 2019, according to AASLH’s 2020 National Visitation Report. More than 1,100 institutions across the country found almost no change in visitation from 2018 to 2019. But what will be the impact of COVID-19 on visitation in 2020?

According to AAM and Wilkening Consulting, their “National Snapshot of COVID-19 Impact on United States Museums” in October 2020 survey of museums revealed that nearly one-third of executive directors believed there was a “significant risk” (12%) of closing permanently by fall 2021 or they “didn’t know” (17%) if they would survive. Secondly, it showed that “museums are operating at, on average, 35% of their capacity–an attendance reduction that is unsustainable long-term.”

It’s now nearly six months later and time for the field to share our annual metrics to understand what actually happened, not rely on predictions. AASLH is now collecting data for the 2021 National Visitation Survey—it closes on Wednesday, March 31. It takes ten minutes to complete and all survey respondents will receive free, advance access to the results later this year. You will need on-hand your visitation data for 2019 and 2020, and your institution’s budget and staffing for 2020. More details and the survey are available at https://www.surveymonkey.com/r/Visitation2021.

A Mixed Prognosis for Regional Museum Associations

In the United States, museums are served by six regional museum associations that are associated (allied?) with the American Alliance of Museums (AAM):

While AAM is doing well with about $10 million in annual revenues and net assets of $2 million, the regional museum associations are much much smaller by comparison. Their annual revenues range from $70,000 to $600,000, which is 1-7% of AAM’s annual revenues (see Figure 1).

Figure 1. Chart of revenues for regional museum associations in the US, FY 2014-16.

That might be acceptable given these associations serve a few states rather than all 50, but a further analysis of their financial condition in fiscal years 2014-2016 suggests that their health is decidedly mixed: Continue reading

How a Briefcase Led to a Clever Way to Conduct Visitor Research Online

Bolt Brief by WaterField Designs of San Francisco.

If you want to conduct visitor research for a potential exhibition, school program, or tour, you might want to check out WaterField Designs in San Francisco, who has been designing and manufacturing bags and cases since 1998.  A few months ago I purchased a Bolt Brief from WaterField. It’s a great bag and I recommend you check it out, but more importantly, I’ve become very impressed with their customer research and prototyping for new products, especially if the customers are all over the country. It’s an idea that can be easily adopted by museums and historic sites if they have Continue reading

Is Twitter Effectively Engaging Your Audiences?

twitter-afpWith the new year on the horizon, I’ve been evaluating my projects from the last year to determine how I can help historic places better connect to their audiences. For the past two years, I’ve used Twitter to share news about history, historic sites, historic preservation, and history museums.  Each morning I scan the New York Times and other newspapers for stories, aiming to tweet about three stories daily to my @maxvanbalgooy account so that my followers can quickly learn what’s happening.  The result? I have created 4,180 tweets and attracted nearly 500 Followers since I joined Twitter in June 2009.  This blog, on the other hand, has 1000 subscribers, so it seems my time is better spent on my blog than Twitter.  It could be very different for you, but how do we decide if Twitter is effectively engaging your audiences?

A useful place to start is with the metrics that Twitter provides: Followers and Likes.  Likes are a low level of engagement because they only require that readers support a specific tweet or find it especially useful or enjoyable—but that’s it. Followers are a mid-level form of engagement because it means that a reader wants to engage with you and read everything that you tweet (“read” is probably overstating things; “scan” is more appropriate for Twitter). Retweets engage at a high level because your Followers share your tweet to their Followers (did you follow that? it’s about the impact of the multiplier effect)—unfortunately, there’s no easy way to measure Retweets (but boy, we would have more impact if we promoted Retweeting instead of Liking).

To better understand how effectively Twitter can engage audiences, I collected statistics for a variety of major history organizations to measure Tweets, Followers, and Likes as of today (December 8, 2016) to develop the following chart: Continue reading

Video: Evaluation Consultant Randi Korn on Impact

In this 2:01 video, Randi Korn explains how museums and historic sites can define impact and how an “impact statement” integrates personal passion, the organization’s strengths, and the audience’s interests and needs.  And to measure impact you have to go beyond the usual numbers involving attendance and income and instead look at the experience that people had.  This is one in the “Questions of Practice” video series produced by the Pew Center for Arts and Heritage.