

In the world of small museums, location and audience significantly influence expenses, rendering a one-size-fits-all approach ineffective. However, gaining insight into the various types of expenses museums incur can shed light on common challenges and their causes. The non-profit financial Form 990 categorizes expenses into five areas, providing a framework for understanding spending patterns. Our goal is to simplify the concept of museum spending and guide museums toward prudent budget management by exploring these key expense categories.
Continue readingAuthor Archives: Colin Gliniecki
Untangling the “Other” Revenue Stream

In the colorful tapestry of history-focused organizations, every thread of revenue has a role to play in the success of the organization. Perhaps the most unique collection of these threads is the “Other” revenue category. This singular “Other” thread houses a miscellany of revenue sources that don’t fit into the categories of “Investment Income”, “Program Service Revenue”, and “Contributions and Grants”. At first glance, this classification may appear insignificant, yet it often proves to be a silent contributor that underpins the fiscal health of History-Focused Organizations [Museums (NTEE A50), History Museums (A54), History Organizations (A80), and Historical Societies & Historic Preservation (A82)].
Understanding this “Other” revenue can be like deciphering an ancient dialect. It is made no easier by the fact that IRS Form 990 at times uses the terms revenue and income interchangeably. While some categories of this revenue such as royalties and inventory sales may be familiar, “miscellaneous” often contains difficult to parse odds and ends such as third-party events, insurance proceeds, ATM fees, and revenue from hosting satellite towers. Most often this miscellaneous revenue is unspecified and simply named “miscellaneous” or “other” which can make it difficult to get the full picture of a particular institution’s revenue sources. We advise limiting the classification of your total revenue as “miscellaneous” to no more than 1%. While judicious use of this category can help define your other revenue streams more clearly, overuse could lead to a lack of clarity about a significant portion of your revenue. It is crucial to maintain a comprehensive understanding of your financial situation.
Continue readingImpact, Sustainability, and Non-Profit Programs

For small non-profit organizations operating on less than a million dollars annually, programs are often the beating heart of the operation. The best programs balance mission and financial sustainability to serve their audiences. Program revenue (admissions, events, and membership dues) can be a vital means of maintaining financial stability and growth. For History-Focused Organizations [Museums (NTEE A50), History Museums (A54), History Organizations (A80), and Historical Societies & Historic Preservation (A82)] as overall revenue grows, so does the share of program revenue. This means as your organization grows, so should the prominence of your programs as a true revenue driver (see figure 1 below).
As small history-focused organizations expand, it’s crucial to manage their programs wisely to increase income while keeping the mission in mind. For small groups, program decisions can be very personal, often influenced by board or staff interests. Taking a strategic approach to these decisions can boost the organization’s growth and success.
Continue readingWhat Drives Revenue at History-Focused Organizations?

If a well-managed museum has robust programming, a large endowment, and a profitable gift shop, should they still rely on contributions and grants? Often regarded as a fundraising burden to reduce or eliminate, instead we might want to consider these revenue sources as one of the best ways to sustain and expand an institution. Sixty-six percent of History-Focused Organizations [Museums (NTEE A50), History Museums (A54), History Organizations (A80), and Historical Societies & Historic Preservation (A82)] depend on contributions and grants for at least half of their annual revenue and nearly forty percent rely on contributions and grants for more than three-quarters of their revenue (see Figure 1 below).
To maximize revenue, museums must navigate fundraising in the present and future. Understanding the donor and engagement pyramids simplifies fundraising and ensures focus. Small history-focused organizations, in particular, must invest their limited bandwidth strategically to achieve success.
Continue readingHow can History-Focused Organizations Invest in Stability?

Over the past year, Engaging Places has been looking over individual segments of the museum field. While these segments are unique in specific ways, as demonstrated by the data, several of them do share a common theme and mission: an overall goal to promote history. These four segments are History Museums (A54), History Organizations (A80), Historical Societies & Historic Preservation (A82), as well as the broad Museums (A50) category. By combining these segments we can focus on the history-centric portion of the museum field that makes up close to half of its revenue and consists of a whopping 89% of its institutions (see Figure 1). This block of museums is incredibly dominant within the field and a major focus of Engaging Places’ work. For ease of reference, we will be referring to them as History-Focused Organizations.
It is important to remember that as an aggregate these History-Focused Organizations still trend small. Over 90% operate on less than $1 million in revenue annually, with contributions and grants bringing in over half of that vital revenue. For these smaller museums, financial security is a constant and essential priority. While many of these History-Focused Organizations are unable to achieve large pools of investment to stabilize operations, unlike some of their larger counterparts, they can develop practices to move them in this direction.
Continue readingShould Local History and Historic Preservation Dominate the Museum Field?
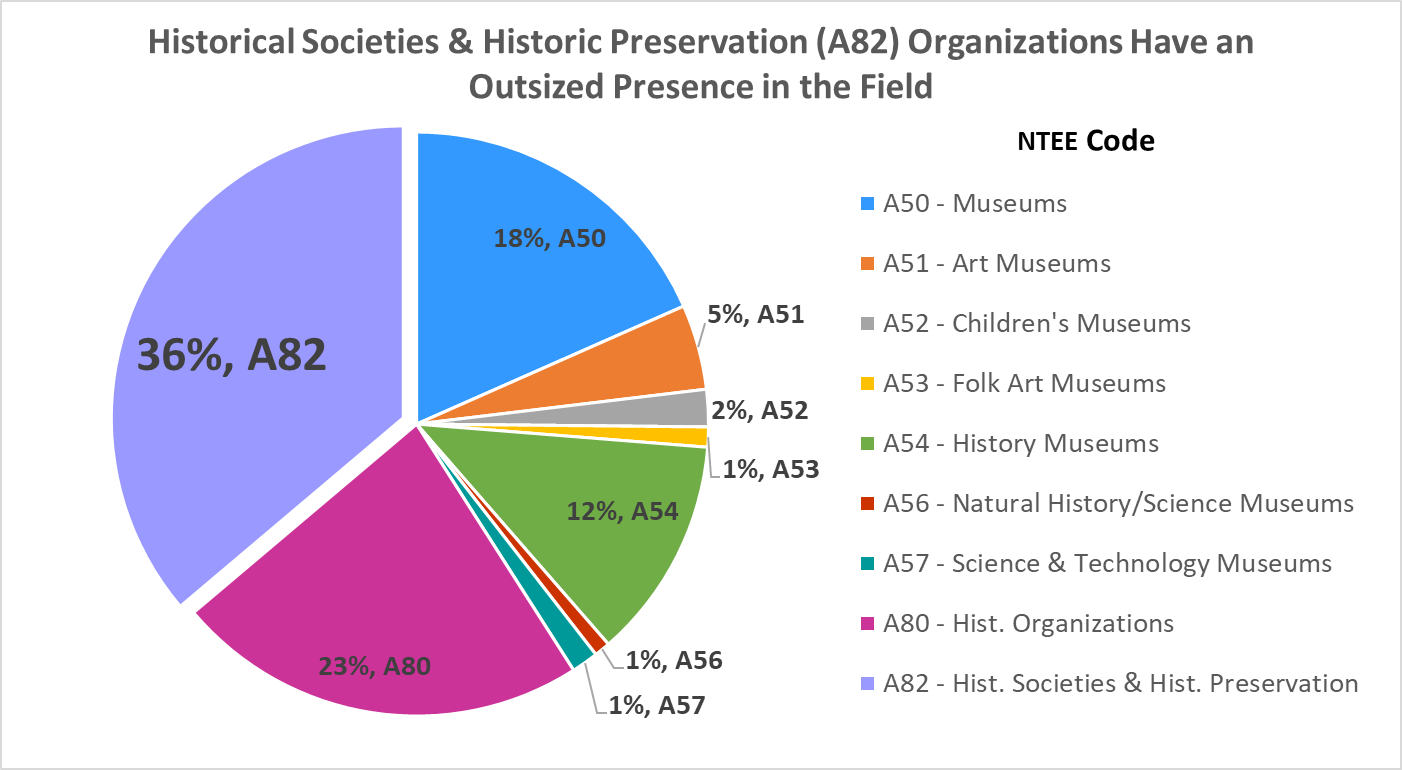
Of all the organizations in the United States devoted to arts, culture, and humanities, Historical Societies & Historic Preservation (NTEE A82) organizations have an outsized presence. More than a third of all organizations “sponsor activities which celebrate, memorialize and sometimes recreate important events in history such as battles, treaties, speeches, centennials, independence days, catastrophes that had an important impact or other similar occasions.” “Historical society,” “historical association,” “heritage society,” “preservation,” and “restoration” are in the name of nearly 80 percent of institutions in this category. They are also focused on local history—only one in twenty institutions appear to have a geographic scope larger than the county level.
While preserving and interpreting local history is their primary interest, these organizations are the smallest by revenue. More than 90 percent operate with less than $1 million in revenue annually and have a median revenue near $64,000 (yes, the median is $64,000 annually for all A82 organizations for 2011-2017—half of these organizations operate with less than this amount). Only Historical Organizations (A80) produce similar financials, albeit with slightly higher figures.
Continue readingAre Historical Organizations Choosing the Right Heroes?

When your history organization is modeling itself on other museums or historical societies, are you choosing the right ones? Are they doing things that are well within your capacity or are you following an impossible dream? There’s nothing wrong with observing the extraordinary leaders in the field, but if you’re modeling your life on a superhero, you may be destined for an avoidable series of crashes and burns. You would have been much more successful had you devoted your time and energy on more achievable efforts.
For example, Historical Organizations (NTEE Code A80) are “organizations that promote awareness of and appreciation for history and historical artifacts,” which is mostly composed of local historic sites, house museums, and memorials that are not solely history museums or historical societies. A sample of Historical Organizations shows that many focus on local history, support museums, or memorialize people, places, or events (see Table 1). Of the 2,500 Historical Organizations providing IRS Forms 990 in 2017, nearly 40 percent include the words “memorial,” “foundation,” “friends,” or “association” in their names.
Continue readingNearly 50% of History Museums Operate on Less Than $100,000

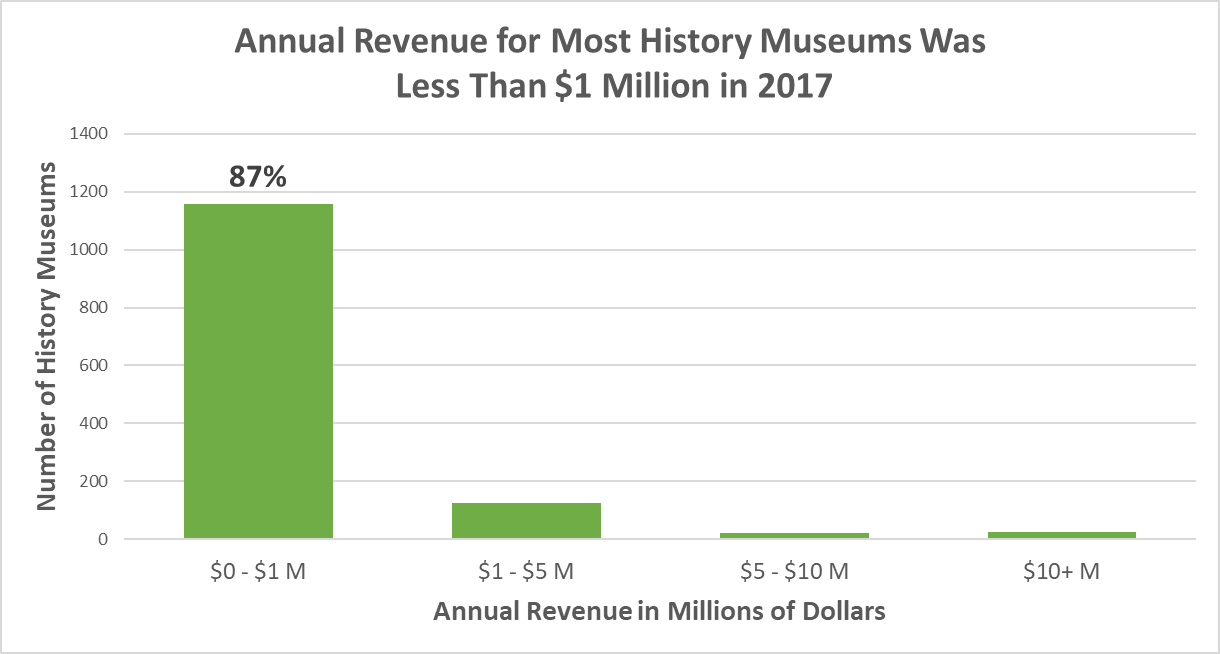
A financial review of more than 1,300 History Museums in 2017 reveals that nearly 90 percent operate on less than $1 million annually, and nearly half on less than $100,000 (see Figures 1 and 2). History museums are financially fragile, but an annual increase in revenue of $5,000 to $10,000 could have a tremendous impact on their capacity and impact. How might this be achieved? Hints of potential solutions are revealed in the changing revenue patterns of larger museums.

A closer look shows that most History Museums derive about 60-70 percent of their revenue from “unearned” sources (i.e., contributions, grants, investments, fundraising events, membership dues), but the mix changes according to size. Museums with less than $10 million in revenue received 4 to 6 percent of their income from investments, which doubled or tripled in the largest museums to 11 percent. While asking for support from people and foundations (i.e., contributions and grants) remained steady, there seems to be increased attention on making money from money (e.g., interest, dividends, sale of securities, drawing funds from endowments).
Continue readingWhat are “Museums”?
Like art, efforts to define “museum” are challenging and controversial. The American Alliance of Museums takes the “big tent” approach to defining museums—“if an organization considers itself to be a museum, it’s in the tent” (AAM 2008, 3). The Internal Revenue Service, however, takes a different approach, which can be puzzling to the field. It assigns the type of charitable organization (e.g. history museums, elementary schools, forest conservation) with no guidance or approval from the organization. Among the categories is “Museums” (NTEE code A50), which is described as, “Organizations that acquire, preserve, research, exhibit and provide for the educational use of works of art, objects or artifacts that are related to the study of zoology, biology, botany, mineralogy, geology and other natural sciences; history; archeology; or science and technology.”
An analysis of IRS Forms 990 of museums identified as NTEE code A50 reveals the incredible diversity of the field as well as challenges our notions of “museum” (see list of examples in Table 1; a complete list is available as a pdf). Consisting of roughly 18 percent of the entire museum field, Museums (A50) are the third-largest type behind Historical Organizations (A80) and Historical Societies & Historic Preservation (A82) (see Figure 1). While large in number, Museums (A50) have fewer resources than the average player in the field, but are growing faster. They hold average net assets of $3,501,000, which is 28 percent lower than the museum field as a whole, but their average net assets increased 11 percent year over year compared to the 4 percent average of the entire museum field. They are also united by their smaller scale and resources rather than subject matter with more than 85 percent of institutions receiving less than $1 million in revenue each year (see Figure 2), confirming the value of providing targeted services to small museums, such as the Small Museum Association, or funds, such as NEH’s Preservation Assistance Grants.
Continue reading