

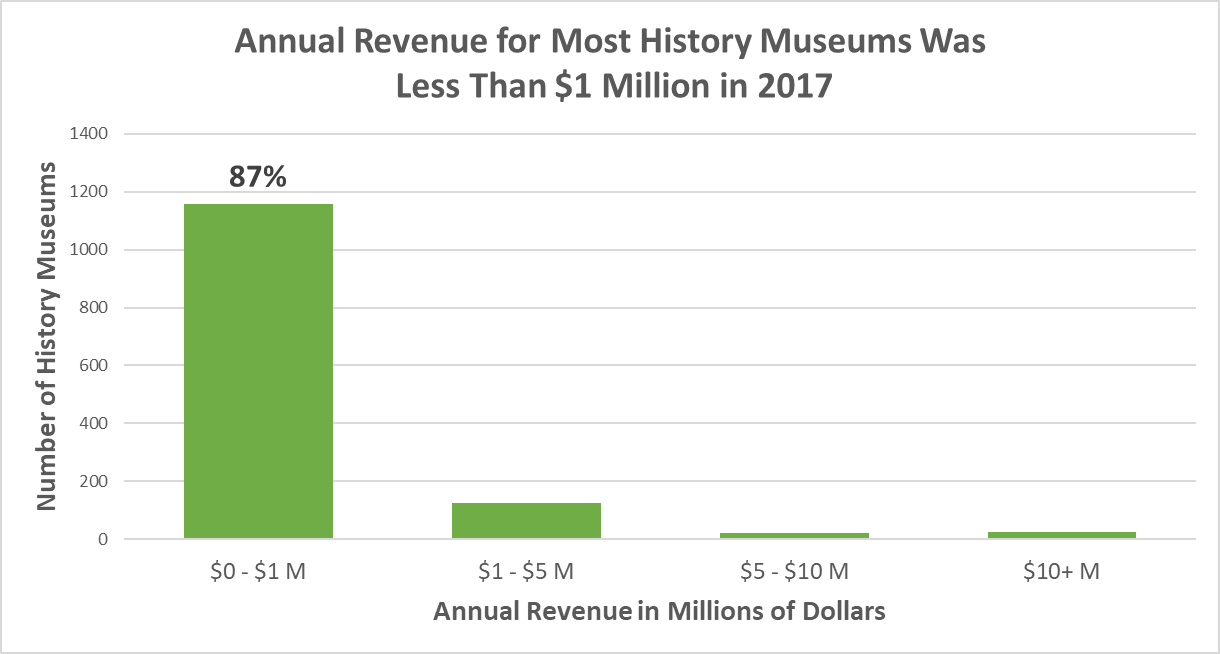
A financial review of more than 1,300 History Museums in 2017 reveals that nearly 90 percent operate on less than $1 million annually, and nearly half on less than $100,000 (see Figures 1 and 2). History museums are financially fragile, but an annual increase in revenue of $5,000 to $10,000 could have a tremendous impact on their capacity and impact. How might this be achieved? Hints of potential solutions are revealed in the changing revenue patterns of larger museums.

A closer look shows that most History Museums derive about 60-70 percent of their revenue from “unearned” sources (i.e., contributions, grants, investments, fundraising events, membership dues), but the mix changes according to size. Museums with less than $10 million in revenue received 4 to 6 percent of their income from investments, which doubled or tripled in the largest museums to 11 percent. While asking for support from people and foundations (i.e., contributions and grants) remained steady, there seems to be increased attention on making money from money (e.g., interest, dividends, sale of securities, drawing funds from endowments).
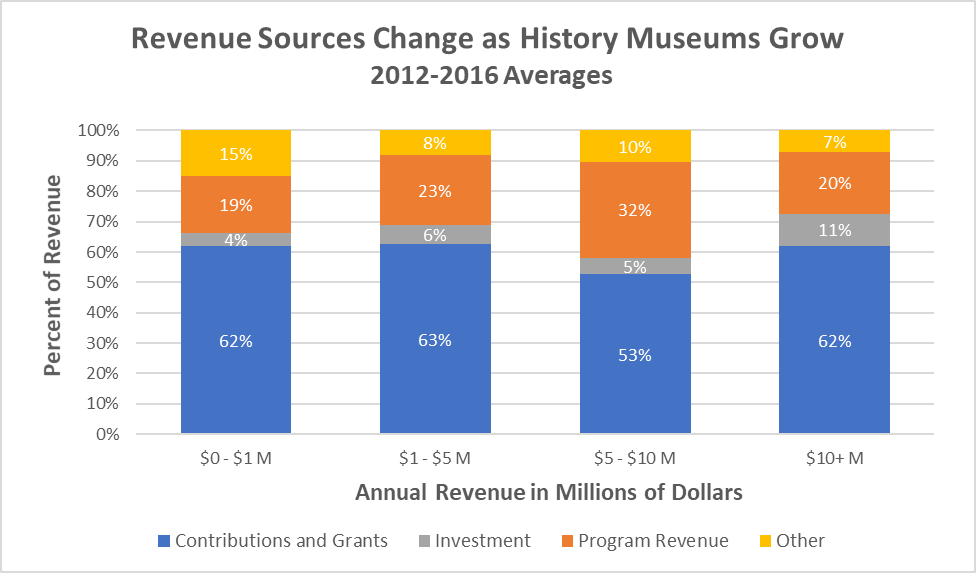
The second major shift among History Museums with less than $10 million in annual revenue is the increasing reliance on “earned” sources (i.ed., selling a service or product). Admission fees, retail sales, weddings, site rentals, and other sources expanded considerably when the smallest and largest museums in this group are compared. Earned revenue seems to be the path towards growth, but it is also a more complex one as the organization has to develop and maintain new revenue streams. Managing a museum store or wedding rentals are essentially small specialized businesses within a larger business.
Finally, the mysterious “Other Revenue” category declines significantly from 15 to 7 percent. The IRS brings together an unusual combination of earned and unearned revenue sources into “Other Revenue,” including royalties, rental income, fundraising events, gaming activities, and merchandise sales. Determining what is happening in this significant category will require additional analysis (it’s doubtful that royalties and gaming activities are an important source of revenue, but the others could be).
History Museums also offer two surprises. The first is that the smallest organizations have investment income. Having managed a very small history museum, revenues were so tight that it was difficult to put money aside for the future. And when we made investments, the board preferred Certificates of Deposit—it had the lowest risk but also paid out the least. But some History Museums are doing much better. The average History Museum with less than $1 million in revenue is bringing in $40,000 from investments each year—that’s dividends, interest, and sales of securities. But investments vary—some provide predictable moderate returns and others less predictable but often greater returns—so what are the practices of the museums with the highest return on investments? The answer might suggest a path towards increased financial sustainability.
The second surprise is that the revenue mix in the largest ($10 million or more) and smallest History Museums ($1 million or less) is about the same. Both receive about 20 percent of their revenue from programs and 60 percent of their revenue from contributions and grants (see Figure 3). Obviously, large museums have a large fundraising staff with the skills, experience, and institutional reputation to attract donations and grants—the very skills that would seem to be lacking in the smallest museums. Or are they? Perhaps the path to sustainability is NOT expanding activities into earned revenue sources but instead focusing on fundraising that will increase the endowment. Again, this deserves closer scrutiny and we’ll share what we discover in a future post.
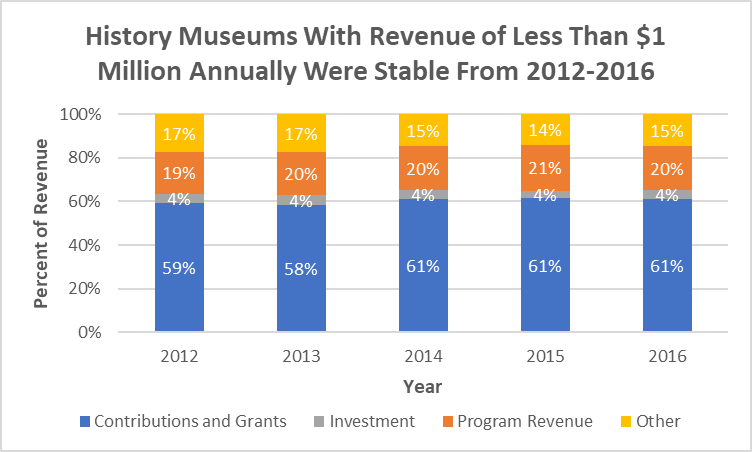
Finally, revenues at History Museums have grown 3 percent from 2012 to 2016 with the combination of revenue sources holding steady. For example, for History Museums with less than $1 million in revenue each year, the mix of revenue sources remained stable year to year with a slight growth in contributions and grants (see Figure 4). That might have changed during the pandemic, but initial data from the U. S. Census Bureau suggests that the impact of COVID-19 was not as bad as predicted.
In our next post, we will be looking at the History Organizations (A80) type of museum. While often small in size, they should not be discounted as an important part of the museum field and their ability to spread culture outside of major urban areas.
Table 1. Examples of History Museums (A54)
| Museum | Location | Website |
| Laura Ingalls Wilder Park & Museum | Burr Oak, Iowa | www.lauraingallswilder.us |
| Custer Battlefield Historical and Museum Association | Hardin, Montana | www.custerbattlefield.org |
| Stax Museum of American Soul Music | Memphis, Tennessee | www.staxmuseum.com |
| Sumner County Museum | Gallatin, Tennessee | www.sumnercountymuseum.org |
| United States Holocaust Memorial Council | Washington, D.C. | www.ushmm.org |
| Montpelier Foundation | Montpelier, Virginia | www.montpelier.org |
| Skyscraper Museum | New York, New York | www.skyscraper.org |
| Alamo Trust Inc | San Antonio, Texas | www.thealamo.org |
| Dallas Holocaust Museum | Dallas, Texas | www.dhhrm.org |
| National Building Museum | Washington, D.C. | www.nbm.org |
| Rice Museum | Georgetown, South Carolina | www.ricemuseum.org |
| Pearl Harbor Aviation Museum | Honolulu, Hawaii | www.pearlharboraviationmuseum.org |
National Center of Charitable Statistics Definition of History Museums (A54): Organizations that acquire, preserve, research and exhibit collections of objects including documents, tools, implements and furnishings that have significance in helping to interpret or understand the past. History museums may specialize in a specific era such as early Greece or Rome, a particular geographical region such as California or Appalachia, a particular ethnic or cultural group such as Native Americans or a specific subject area such as costumes; and may contain items created or used by contemporary or historical figures.
2017 A54 Institutions
References
