

When your history organization is modeling itself on other museums or historical societies, are you choosing the right ones? Are they doing things that are well within your capacity or are you following an impossible dream? There’s nothing wrong with observing the extraordinary leaders in the field, but if you’re modeling your life on a superhero, you may be destined for an avoidable series of crashes and burns. You would have been much more successful had you devoted your time and energy on more achievable efforts.
For example, Historical Organizations (NTEE Code A80) are “organizations that promote awareness of and appreciation for history and historical artifacts,” which is mostly composed of local historic sites, house museums, and memorials that are not solely history museums or historical societies. A sample of Historical Organizations shows that many focus on local history, support museums, or memorialize people, places, or events (see Table 1). Of the 2,500 Historical Organizations providing IRS Forms 990 in 2017, nearly 40 percent include the words “memorial,” “foundation,” “friends,” or “association” in their names.
While some of these institutions clearly are, and promote themselves as, museums, most are much more than the Webster’s definition of “a place where objects are exhibited.” While the profession may object to this narrow definition, the IRS does not consider Historical Organizations (A80) or Historical Societies & Historic Preservation (A82) as museums, but as something adjacent to or broader than museums. It’s a reminder that the museum and history field is vast and complex, so when you are comparing yourself to others based on data provided by the American Alliance of Museums, American Association for State and Local History, Wilkening Consulting, or Colleen Dilenschneider, be sure you are part of the data. You might be using data dominated by art museums and zoos or inadvertently comparing your performance to symphonies and theatres. Make sure the comparisons are comparable.

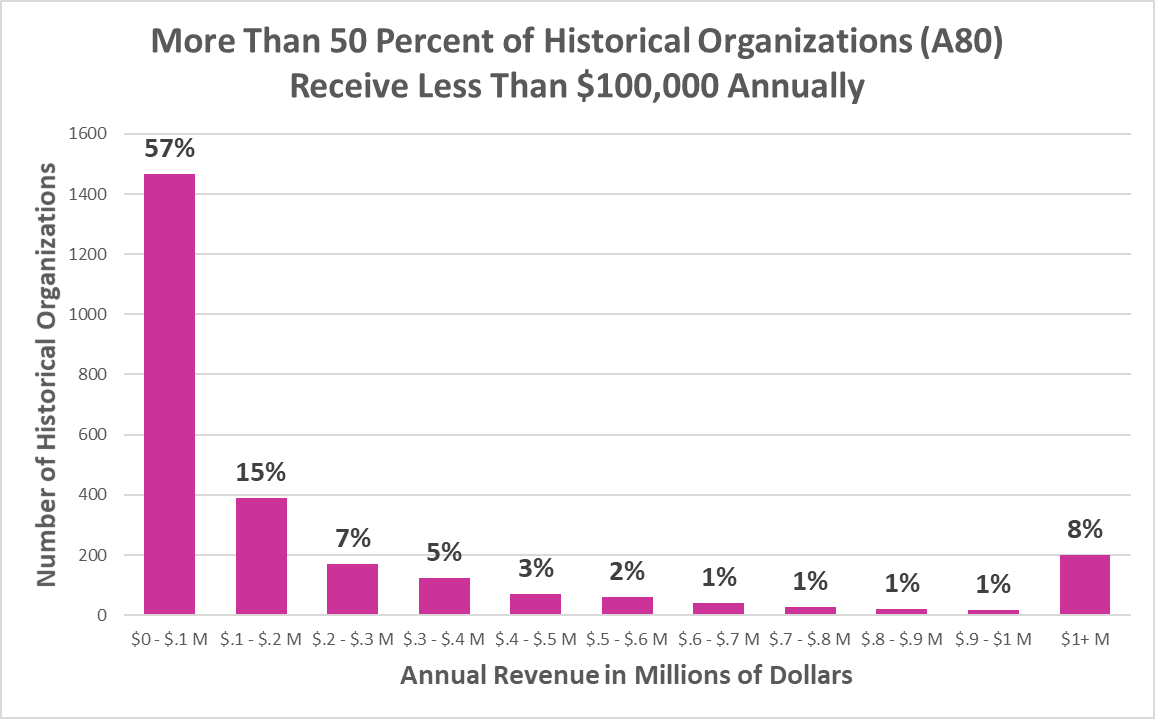
Secondly, size matters and numbers matter. Historical Organizations (A80) make up roughly a quarter of the museum industry, the largest museum type except for Historical Societies & Historic Preservation (A82). Collectively, these two categories represent nearly two-thirds of all museums in the United States (see Figure 1). While large in number, they have fewer resources. Over 90 percent of Historical Organizations (NTEE Code A80) operate with less than $1 million in revenue (see Figure 2) and more than half of all Historical Organizations have revenues of less than $100,000 (see Figure 3). Colonial Williamsburg or Historic Hudson Valley are often used as models for historical organizations, but with annual revenues of $127,332,259 and $11,603,977 in 2017, respectively, they are in the top 2 percent—exceptions to the rule. Again, is your organization developing reasonable goals based on appropriate models, or are you trying to keep up with the Rockefellers (John D. Rockefeller, Jr. founded both of these organizations)? Are small organizations successful only when they become big ones, like Colonial Williamsburg? Or are there better models?

Finally, notice how Historical Organizations (A80) and Historic Societies & Historic Preservation (A82) together represent 59 percent of the larger field (see Figure 1). Statistics such as counts, averages, highs, and lows are significantly affected by these types of institutions—usually to the lower side because of their lower revenues and assets. Excluding these two categories would raise the average revenue of museums from $1 million to $3 million—a 200% increase. When viewing statistics about the field, consider how they define museums and who is included and excluded. Understanding your organization’s position requires understanding its context according to museum type, revenues, and assets (and probably geography).
Still to be explored are the patterns of revenue sources according to annual revenue in Historical Organizations (A80). We expected to find a linear progression upward or downward, but for this museum type, different revenue streams expand and contract depending on the size of the museum, especially in program revenue (see Figure 4). Perhaps Historical Organizations of different sizes have different strengths and thus adopt different business models. Does it reveal that organizations of different sizes need to follow different paths to success? If there is no one-size, fits-all solution, it makes our responsibilities much more complex—but it will make us think more deeply about the meaning of success.

Embracing the idea that there is no one-size-fits-all guide to navigating a museum’s future doesn’t mean one should give up any hope of identifying institutions as role models. It just means that when looking for guidance, stay grounded and learn from institutions that are comparable as much as they are aspirational. This lesson is doubly important for the smaller players who make up a majority of the field while getting the minority of the attention. Download the list of organizations to find those that have comparable revenues.
Exploring and explaining the outsized influence of state and local history on the museum field continues to be a central element of the Engaging Places Financial Mapping Project. After our next article on Historical Societies and Historic Preservation (A82), we will analyze the four museum types that best encapsulate local history. Rather than segregate statistics by NTEE Code as in previous posts, we will synthesize the data to focus on those that emphasize history.
Table 1. Examples of Historical Organizations (A80)
| Museum | Location | Website |
| The Barack Obama Foundation | Chicago, Illinois | www.obama.org |
| Perry House Foundation | Stratford, Connecticut | www.perryhousestratford.org |
| Colonial Williamsburg Foundation | Williamsburg, Virginia | www.colonialwilliamsburg.org |
| Blinn House Foundation | Pasadena, California | www.blinnhousefoundation.org |
| Fort Dodge Historical Foundation | Fort Dodge, Iowa | http://www.fortmuseumfv.com |
| USS Missouri Memorial Association Inc | Aiea, Hawaii | https://ussmissouri.org |
| Texas Jack Association | Salt Lick, Kentucky | https://www.texasjack.org |
| Evangelical and Reformed Historical Society | Lancaster, Pennsylvania | https://erhistoricalsociety.org |
| Historic Hudson Valley | Sleepy Hollow, New York | https://hudsonvalley.org |
| Heritage Farmstead Association | Plano, Texas | https://www.heritagefarmstead.org |
| National Desert Storm Memorial | Washington, D.C. | http://www.ndswm.org |
| Inman Farm Heritage Days Inc | Fayetteville, Georgia | www.mintersfarm.com |

I applaud your effort to make some kind of sense of this data – and am hoping that your conclusions have use for your readers – but there are just too many “wobbly” categories and self-definitions to be sure the underlying information is accurate. When IMLS came out with its “list” of museums, some of us working with state museum associations tried to reconcile what was published with what we actually knew from our own experience. In Arizona (my state) I identified at least 20% of those organizations listed, as NOT being museums (in any kind of definition). Perhaps the best we can say is that there are a lot of museums, a vast majority of them are history-related and relatively small. And that they don’t generally show up on the many of the big, national surveys.
Having said that, please don’t stop trying to work with the existing data – there are lessons to be learned (particularly in terms of how to compare museums) and it’s the only way we’ll ever be able to start gathering better – truly inclusive – information.
LikeLike