A century ago, Henry Gantt developed a way to better manage projects by tracking tasks against time in a chart. Yes, the Gantt chart. While we’ve moved from paper to computers to manage projects, small museums and historic sites usually don’t use project management software, such as Microsoft Project, even though they have lots of projects. The software is either expensive or incredibly difficult to learn, so most rely on crafting Gantt charts in a spreadsheet.
Spreadsheets are an easy method for creating a Gantt chart but they have limited value. They’re usually satisfactory for simple planning but you can’t easily shift from a monthly to a daily view, nor show how tasks affect one another. Could I suggest TeamGantt? By using their free account, you can manage one project with three people—which is probably adequate for most small museums. If you’re clever, you can set-up several projects on one sheet, expanding or collapsing them as needed to maintain focus.
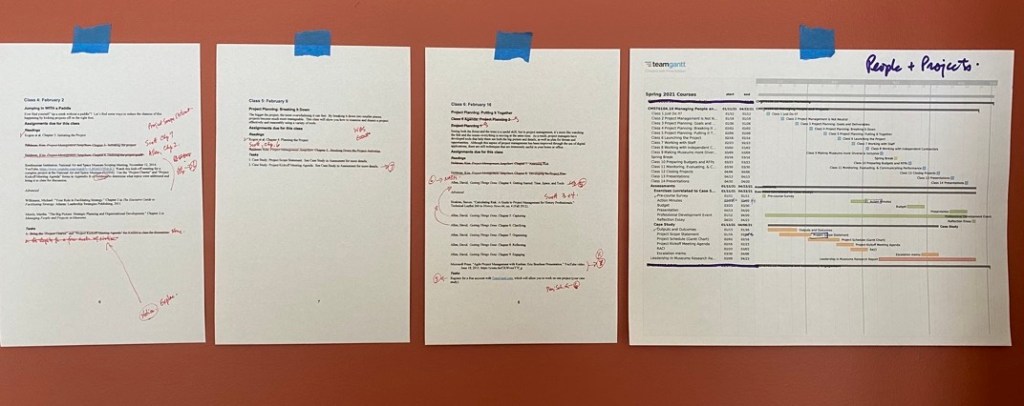
For my course on project management in museums at George Washington University, my graduate students learn how to breakdown a project using TeamGantt. They’re using IMLS-funded projects for exhibitions, school programs, and collections digitization, so it can be easily learned and applied to complex museum projects. I use it to plan my semester-long courses, tracking classes and assignments to ensure they align with each other as well as providing a handy page-at-a-glance overview.
While I usually hate registering for a free service, TeamGantt hasn’t annoyed me with advertising and spam. Instead, it sends out helpful videos and emails that focus on improving my project management skills. Unfortunately, pricing for TeamGantt jumps up sharply from free to $25 per month per person, which is probably out of bounds for most non-profit organizations. Nevertheless, I suspect that most staff in organizations large or small will find free account adequate for their own projects.

Disclosure: This review is a service to the field and I receive no compensation or benefits from the developer/provider of TeamGantt.
