
Digital tools do not automatically produce meaningful interpretation. What they can do—when used with discipline—is force clarity about audience, theme, and purpose. This is why I have begun using ESRI ArcGIS StoryMaps as a core interpretive platform in my graduate course CMST6307: Interpretation of Historic Sites at George Washington University.
This fall, students were commissioned—within a realistic professional scenario—to create StoryMaps interpreting the history of women in Washington, DC. Each project connected five or six historic sites through a coherent theme, tailored to a specific public audience. The results demonstrate how StoryMaps can function not as digital scrapbooks, but as public-facing interpretive products grounded in professional standards.
I’m incredibly proud of what they accomplished, but this isn’t a showcase of student work for its own sake. It’s a case study in how digital storytelling platforms can support the interpretation of historic sites and house museums.
A Professional Product, Not a Classroom Exercise
The assignment was framed as a hypothetical consulting project for the White House Historical Association. Students were told: “The StoryMap should connect 5–6 historic sites through a coherent theme, tailored to a specific audience. It should demonstrate professional standards in historical research, interpretive writing, and digital design.”
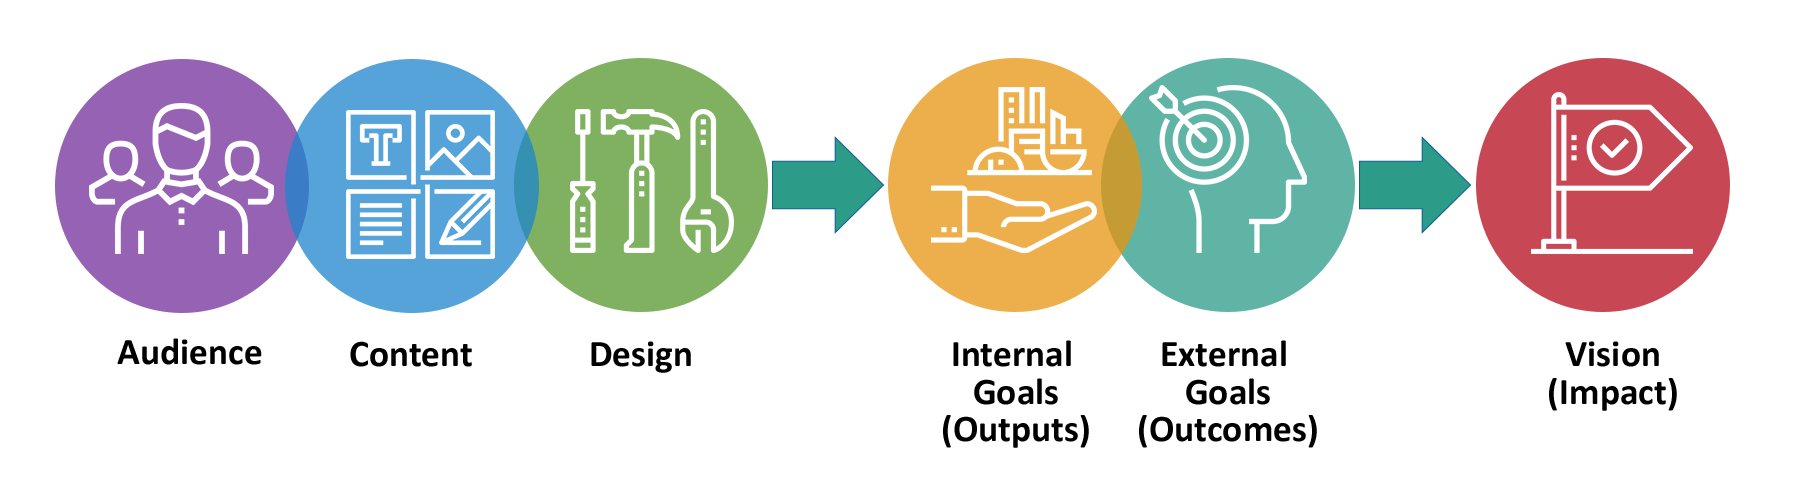
From the beginning, the emphasis was not on technology, but on interpretation. Each student had to demonstrate the integration of three core elements: audience, content, and design.
These ideas are abstract, so I provided an assignment checklist to review their projects before they were submitted. The checklist functions as a professional quality-control tool for digital interpretation, guiding students—and adaptable for museum teams—through seven core areas: interpretive alignment, research integrity, narrative structure, digital design, visual and citation standards, executive communication, and delivery requirements, ensuring that StoryMaps meet both interpretive and professional practice expectations:
- “My theme is specific, interpretive (not just descriptive), and connects all sites.”
- “Each site clearly supports and reinforces the theme.”
- “My writing, tone, and design choices reflect the needs of my chosen audience.”
This language mirrors the standards used in interpretive planning, not classroom grading.
Why StoryMaps Work for Historical Interpretation
StoryMaps are effective because they are inherently spatial, narrative, and visual. They encourage interpreters to:
- sequence content rather than list it
- situate stories in place
- balance text with evidence
- design for multiple devices and attention spans
But the real value is structural. StoryMaps make it immediately obvious when interpretation is unfocused or disorganized. If the theme is vague, the interpretation feels disjointed. If the audience is unclear, the tone shifts unpredictably. If the design overwhelms the content, the narrative collapses. This is why students were required to test their work across platforms and to ensure that:
- “Images, text blocks, and interactive elements are balanced and not cluttered.”
- “Navigation works smoothly on both desktop and mobile devices.”
Design, in this context, is not decoration—it is interpretation. Fortunately, StoryMaps provides a variety of templates to ensure consistent, legible, and attractive layouts for each page, removing the demands of graphic design.
Nine StoryMaps as Interpretive Case Studies
All nine projects interpret women’s history in Washington, DC, yet each does so through a distinct lens:
- “Just Like Our Grandmother’s” – Kennedy Williams. Reinterprets iconic monuments and streets as stages where twentieth-century women used protest and public space to fight for equality and redefine whose history is visible.
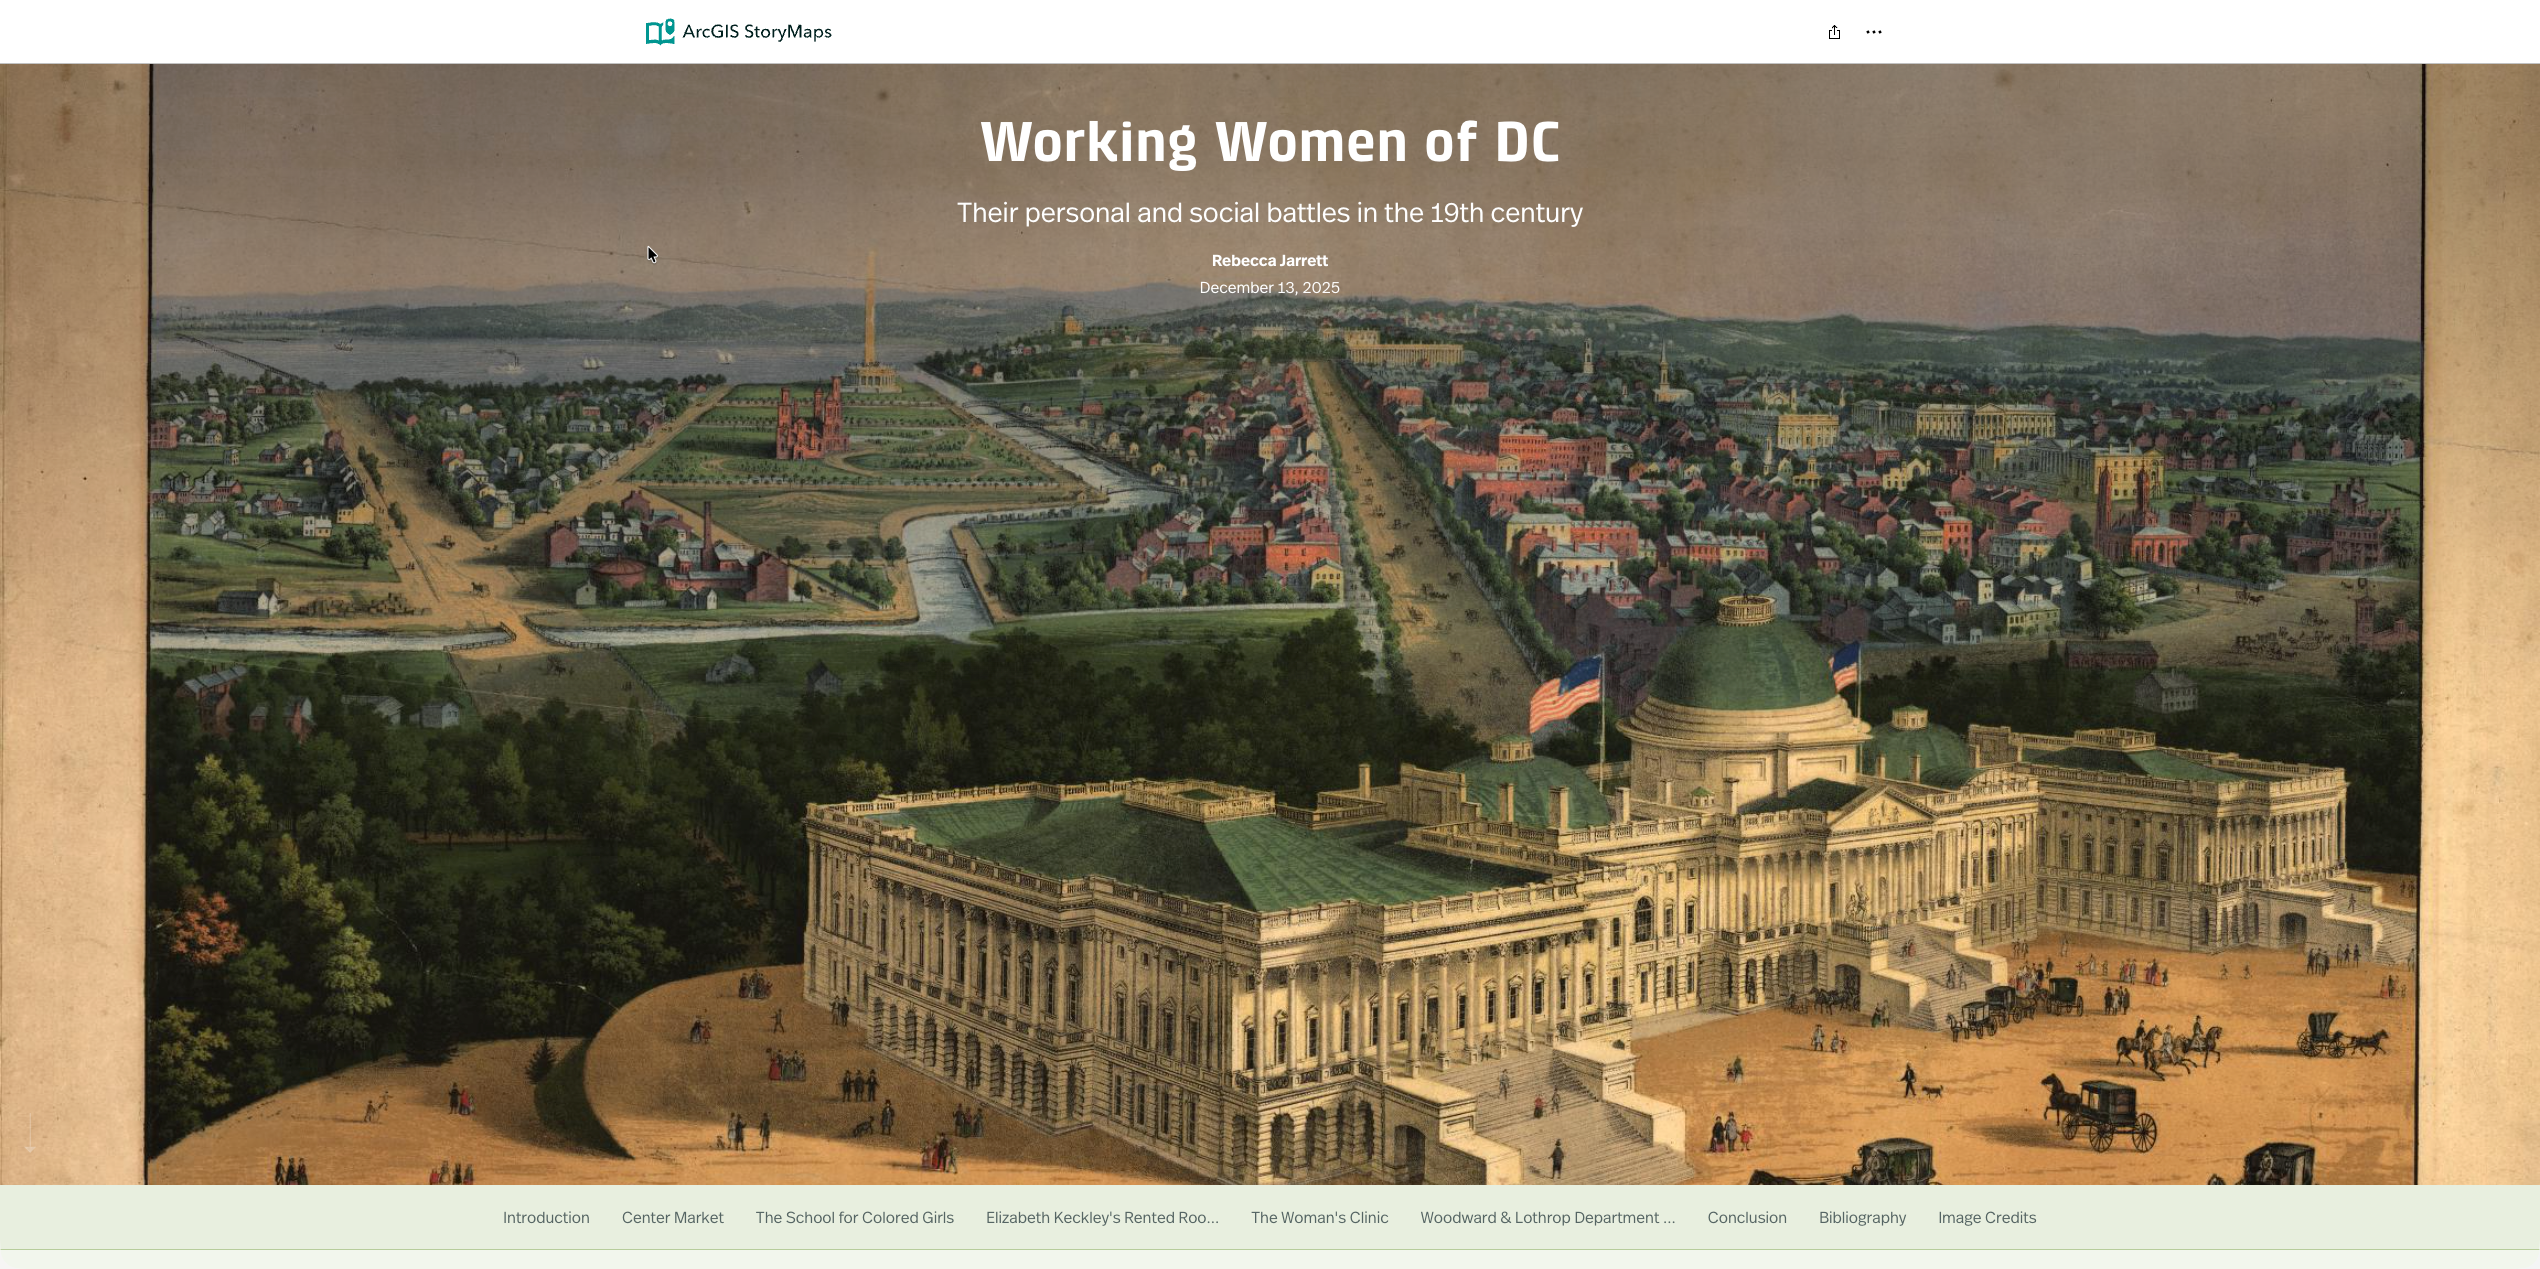
- “Working Women of D.C.” – Rebecca Jarrett. Connects nineteenth-century labor sites to show how working women confronted injustice to claim dignity and opportunity in ways that still resonate today.
- “Women’s Work in Civil War Washington” – Katie Moniz. How women of all classes and backgrounds were essential to the Civil War effort through diverse roles such as clerks, surgeons, spies, and factory workers.
- “Working in Action: Women’s Roles During the Civil War” – Emily Bobal. How overlooked sites and women’s labor during the Civil War formed a dense, walkable landscape of wartime work and resilience beyond the city’s traditional tourist core.
- “Building Better Futures” – Carrie Welter. How women used creative and sometimes unconventional strategies to change their own lives—and the nation—by transforming familiar spaces into sites of possibility and reform.
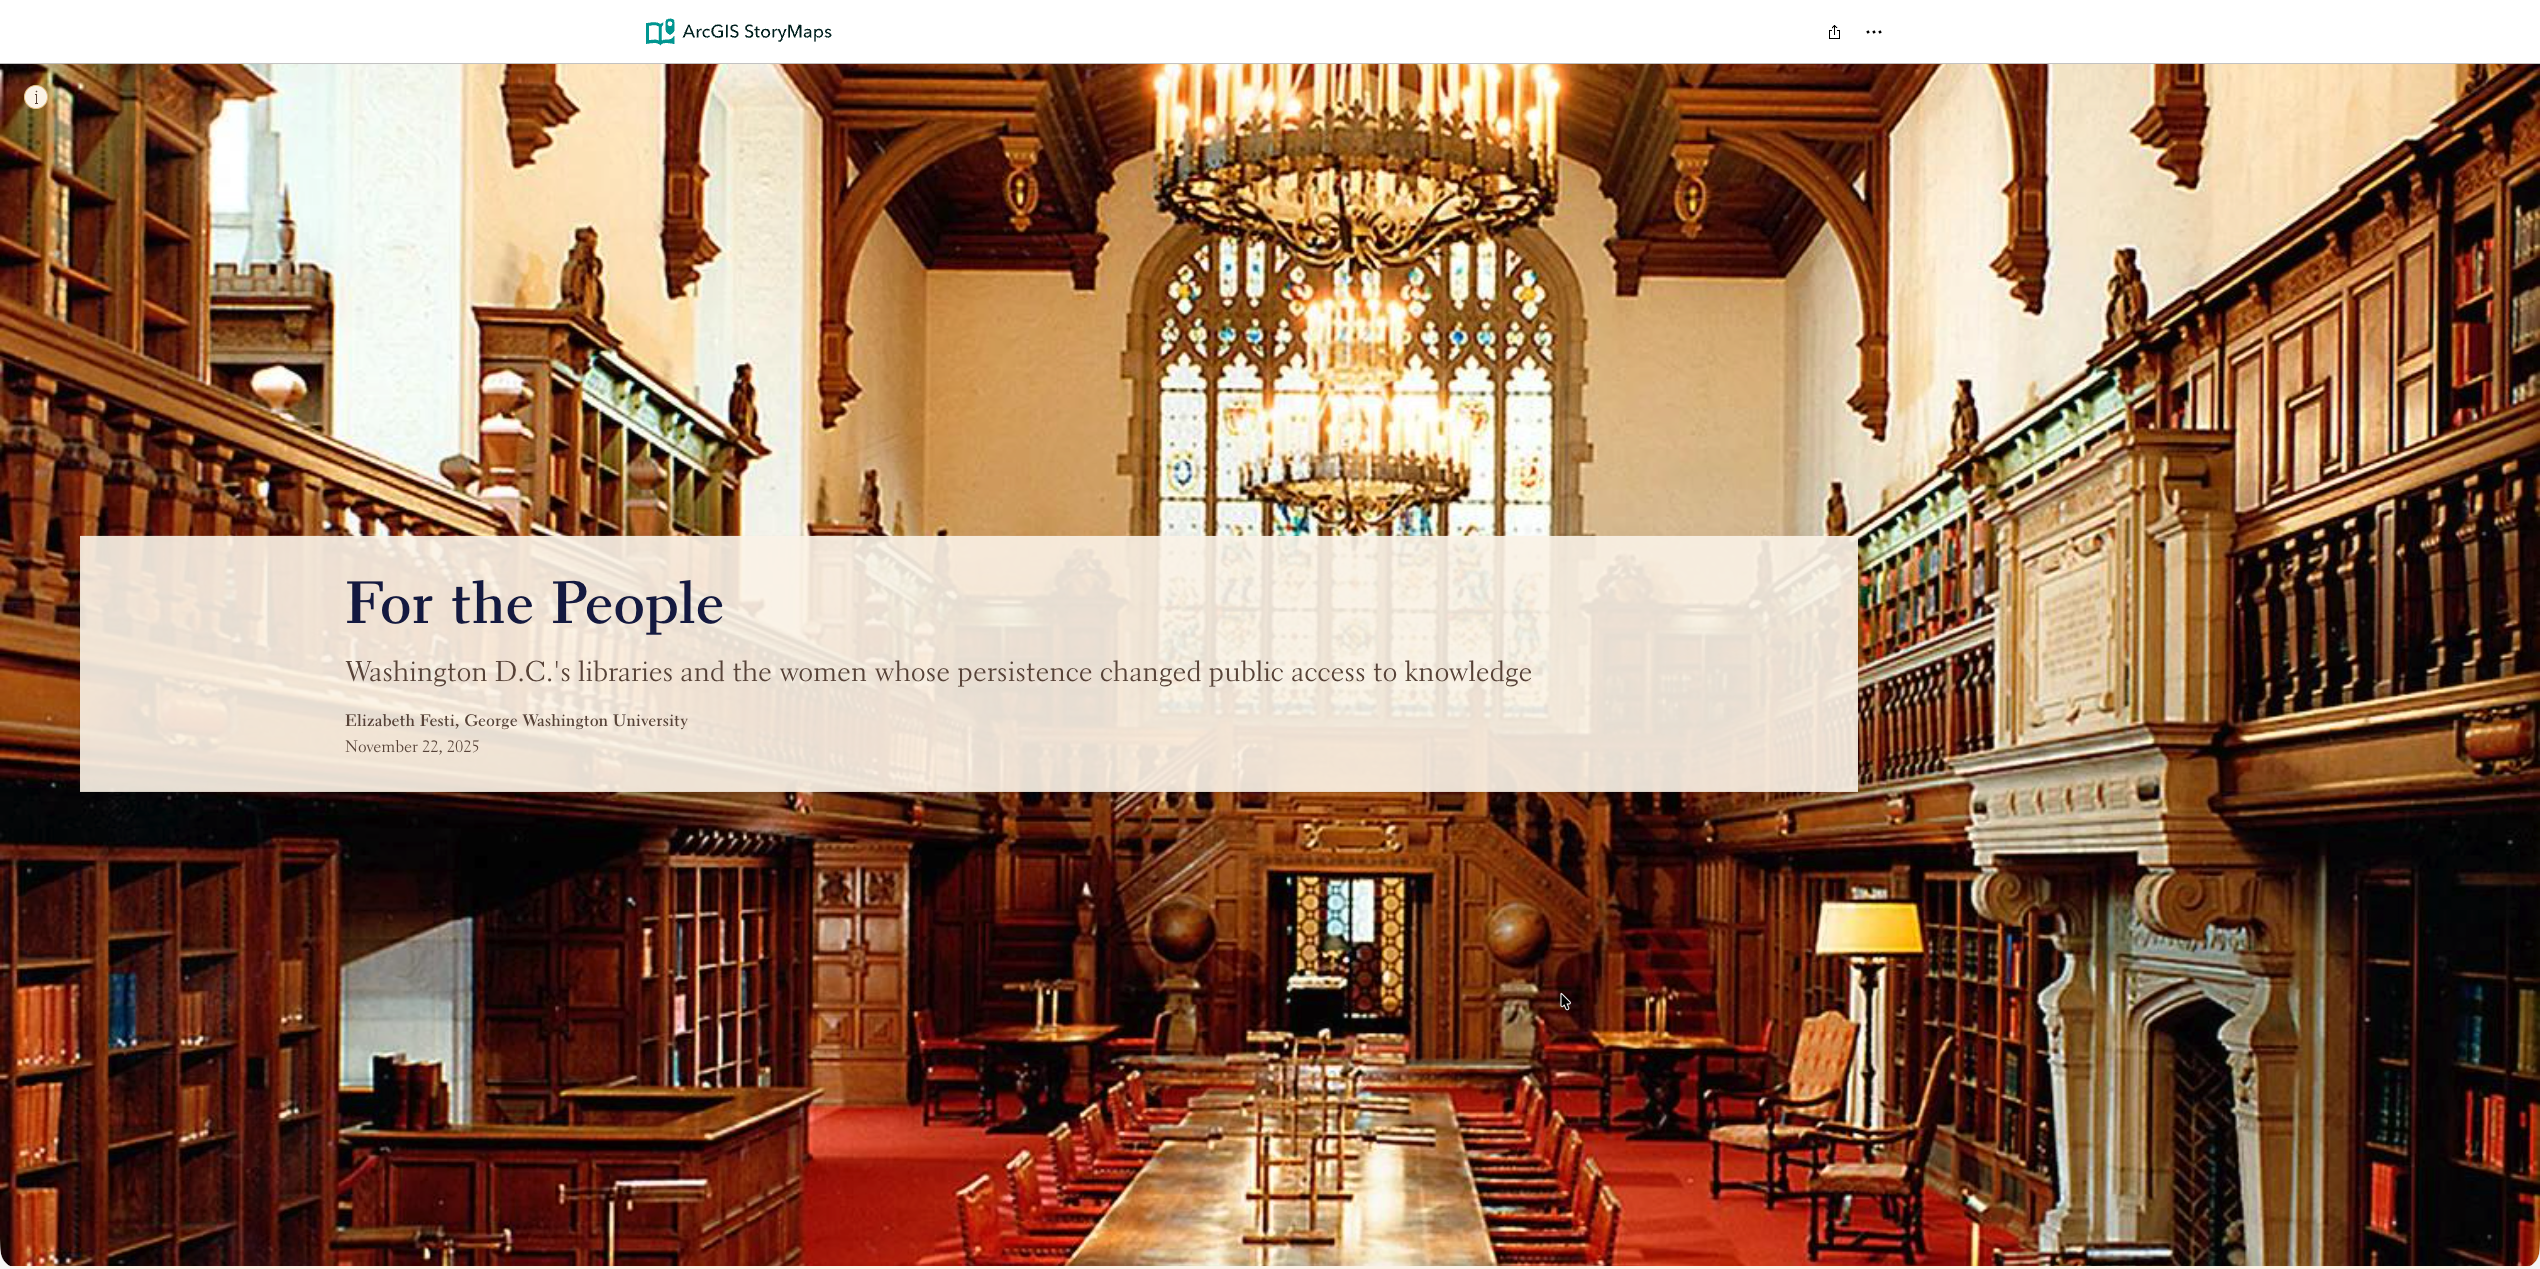
- “For the People” – Elizabeth Festi. How women transformed Washington’s libraries into engines of public access and national change, reshaping who could learn, belong, and participate in civic life.
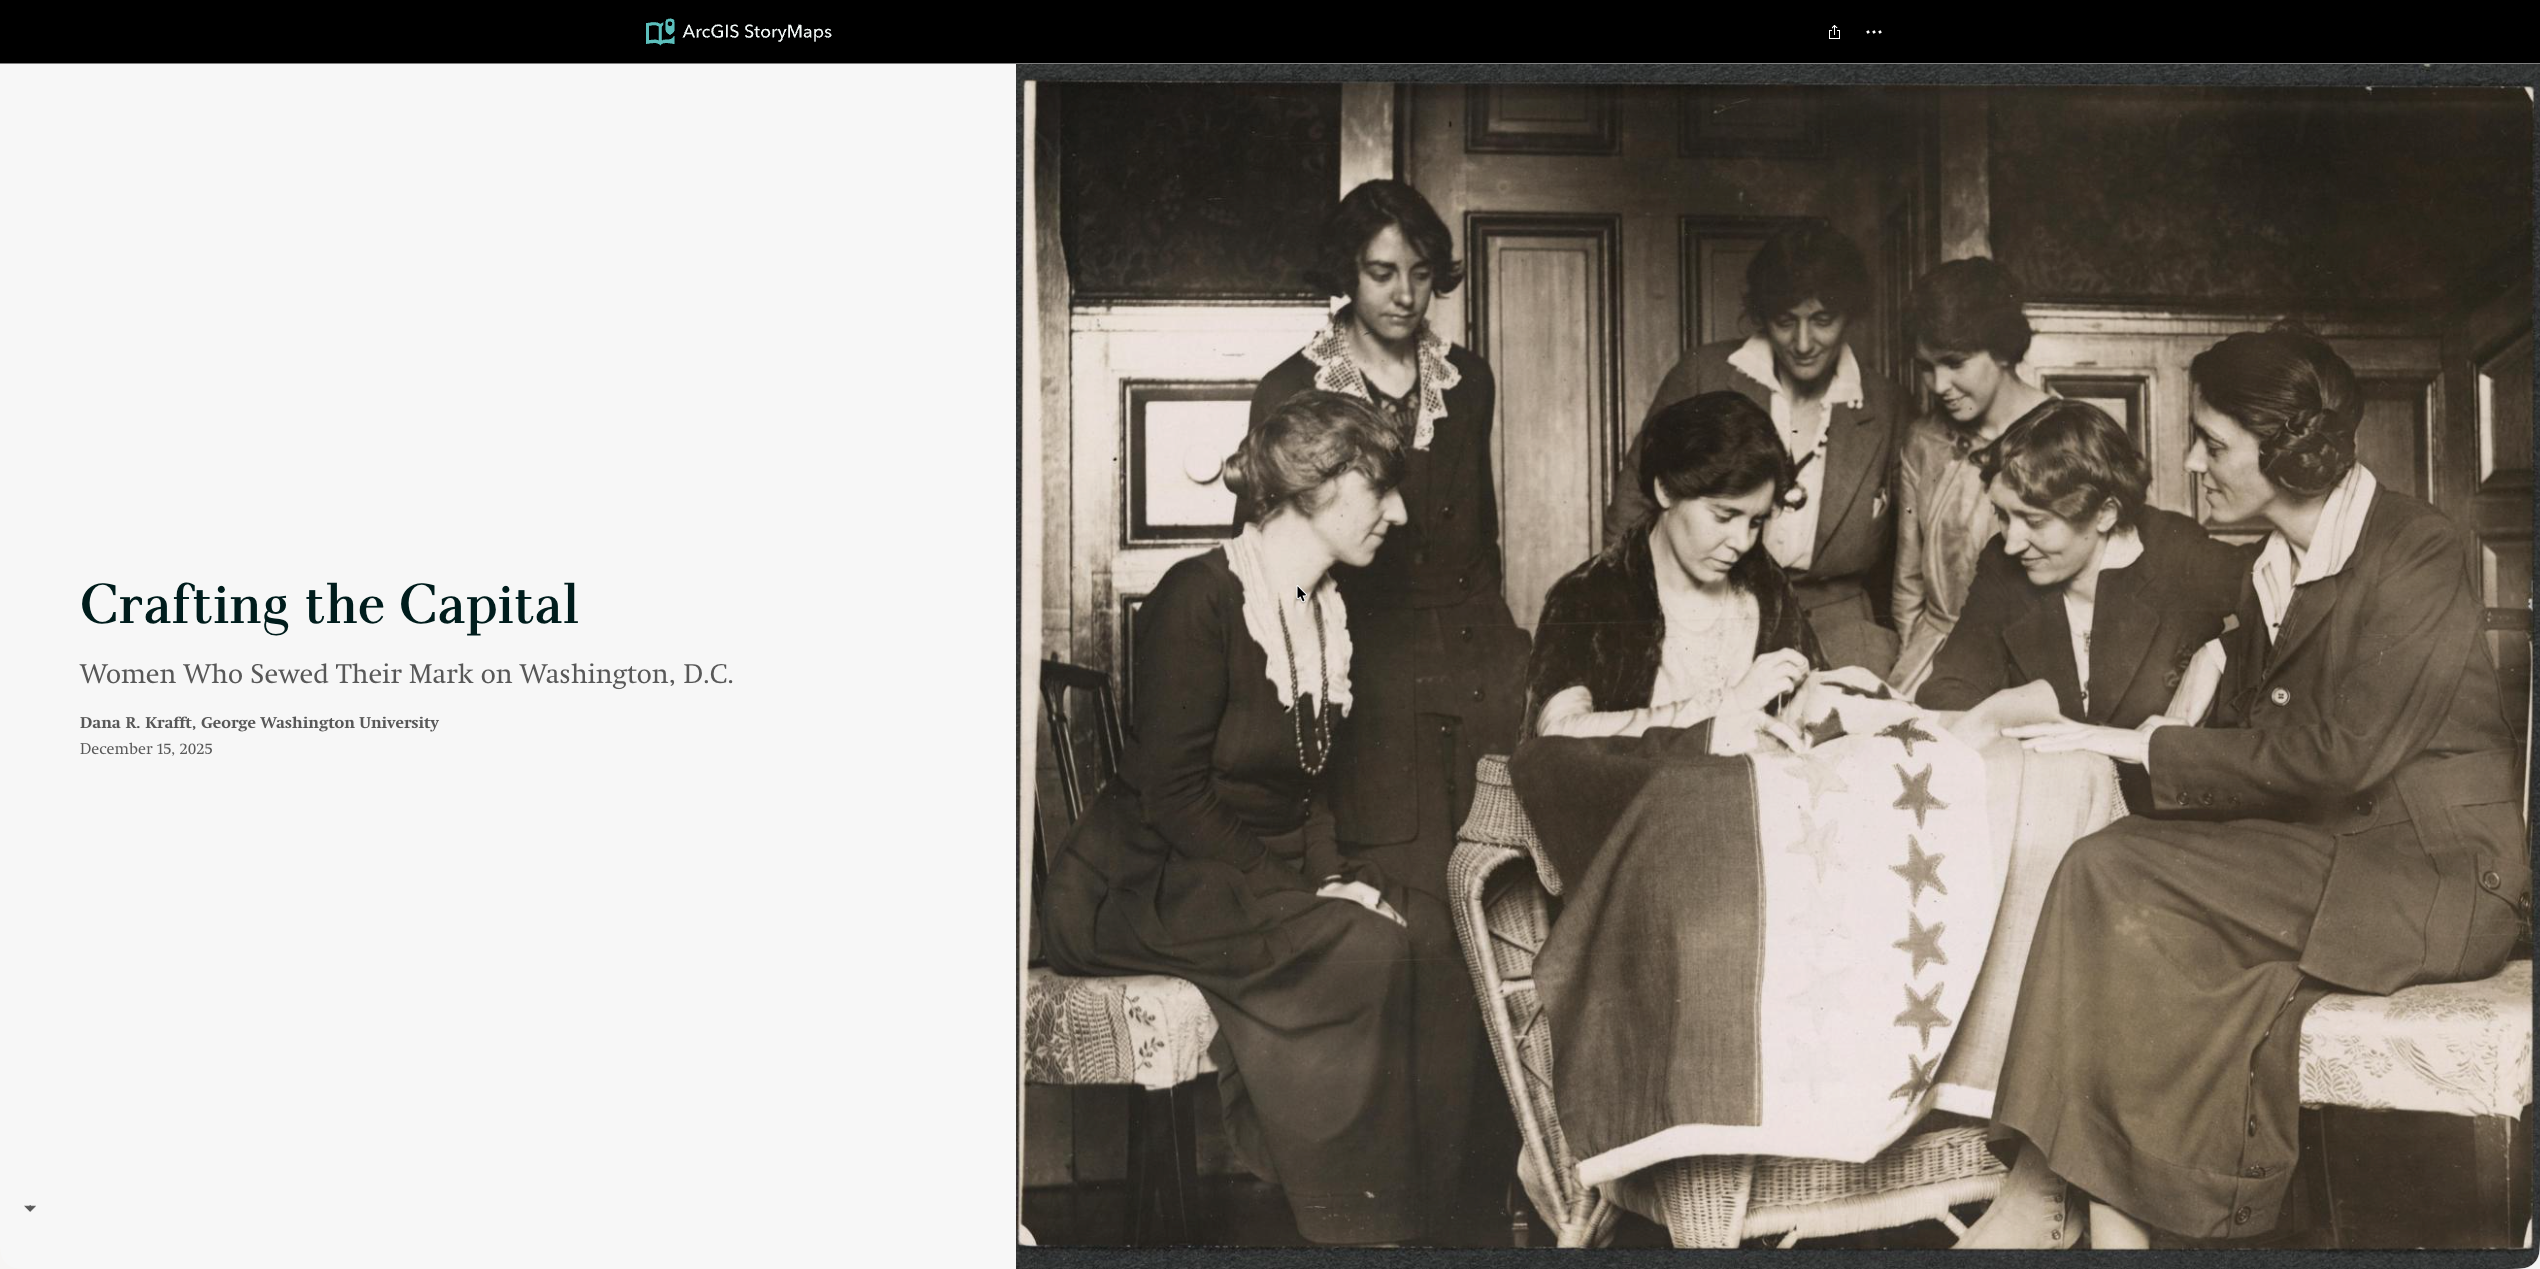
- “Crafting the Capital” – Dana Krafft. How women’s needlework became acts of resilience, protest, and professional pride that reshaped public life in Washington, D.C.
- “A Community Overlooked” – McKenzie Christensen. Honors enslaved women who built community and independence under profound injustice, inviting present-day residents to see their city through these women’s strength and agency.
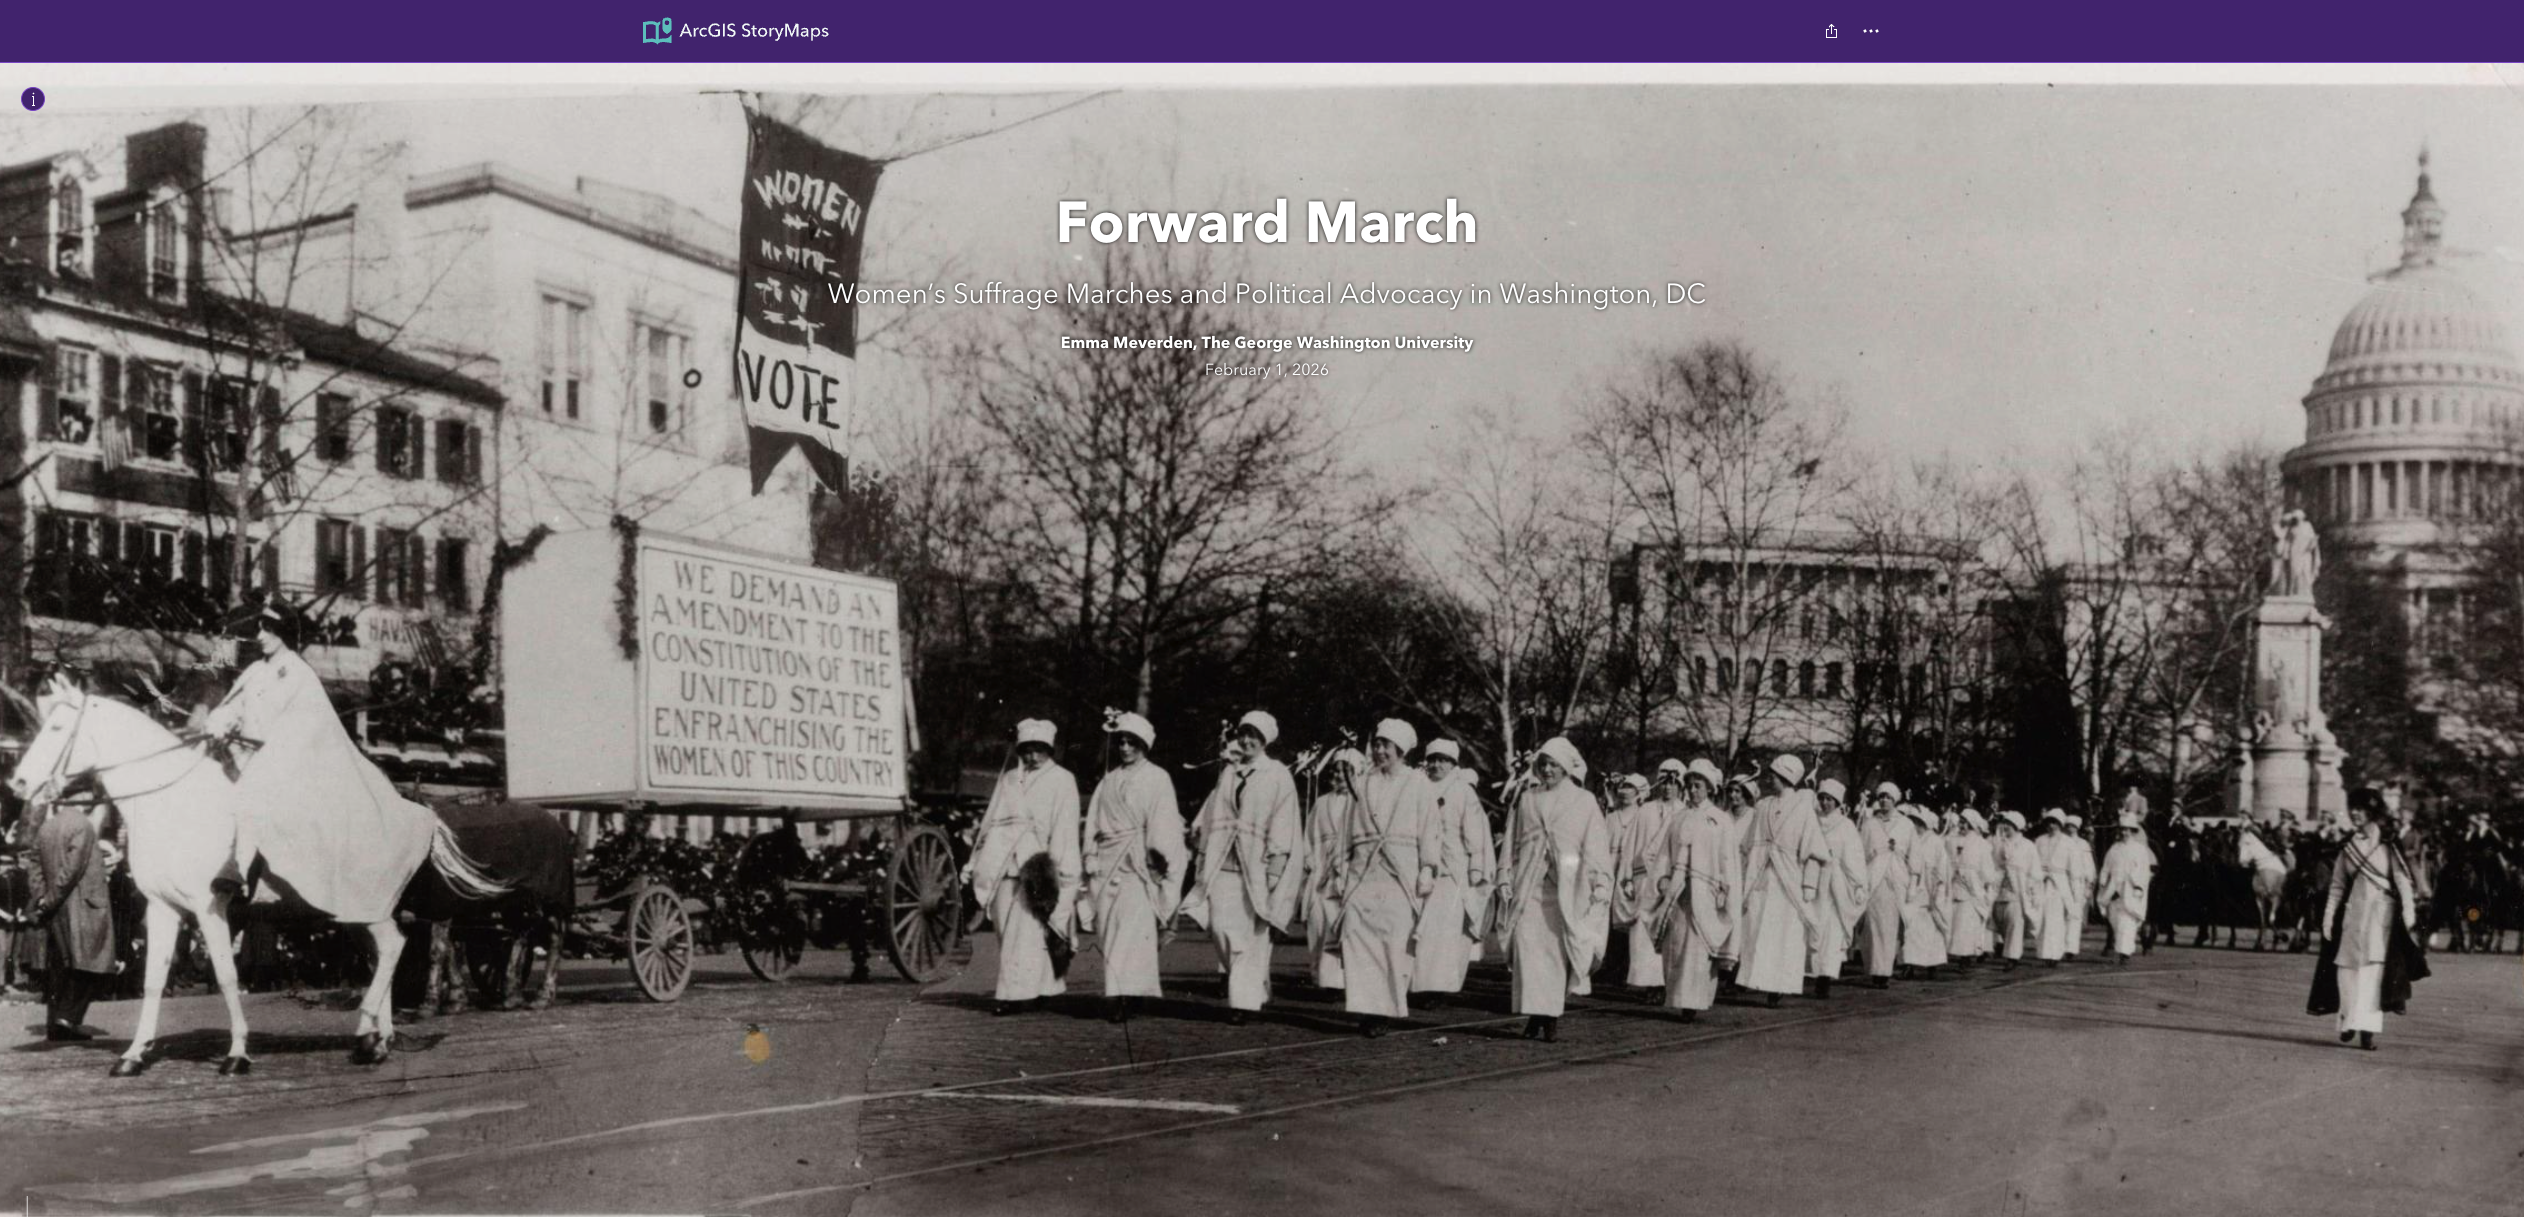
- “Forward March” – Emma Meverden. How ordinary women reshaped American democracy through persistence and collective action at key suffrage sites across Washington, D.C.
Each StoryMap required:
- an introduction (200–300 words) establishing the theme, context, and audience
- 5–6 site entries (150–200 words each)
- conclusion (100–150 words) that brings everything together.
These constraints forced students to move from description to interpretation. They had to synthesize research, not summarize it. As a result, these StoryMaps read less like digital brochures and more like organized narrative experiences.
What Museum Professionals Can Learn
These projects highlight several transferable lessons:
- StoryMaps enforce interpretive discipline. You cannot hide behind long text or sprawling site lists. The structure demands coherence.
- They make audience misalignment visible. When tone, vocabulary, or pacing is wrong, it is immediately apparent on screen.
- They foreground place as evidence. Maps and places are not background—they are part of the narrative.
- They are scalable and sustainable. StoryMaps function as low-cost, high-impact digital interpretation that can complement physical sites, exhibitions, and programs.
A Replicable Model
To conclude, here is a condensed version of the project’s professional checklist—one that can be used by any historic site experimenting with digital storytelling:
- Do we clearly identify our audience?
- Can we state our theme in one sentence?
- Does each site reinforce that theme?
- Are visuals interpreted, not decorative?
- Is the narrative coherent and mobile-friendly?
These questions—more than the platform itself—are what transform StoryMaps from technology into interpretation. If you’d like to create a StoryMap for your museum or historic site, I created a short YouTube video explaining how to get started at https://youtu.be/OexxrqMlPKE.
Pricing for Museums is Opaque
When I tried to figure out the cost of StoryMaps for museums and nonprofits, I ran into a surprisingly murky process. George Washington University has access through its ArcGIS subscription, but I wanted to understand what independent museums might expect to pay (the commercial price ranges from $700-$4,200/year). The ESRI website didn’t list nonprofit pricing, so I reached out directly. Their response: pricing isn’t shared until an organization is approved for the nonprofit program, although most products are discounted somewhere between 50–99%.
That puts museums in an awkward position. To get a basic price estimate—a key factor in any purchasing decision—organizations first have to verify their nonprofit status and enter a separate approval process. From a buyer’s perspective, it feels a bit like sitting down at a restaurant without seeing a menu. Most museum managers are trying to do quick feasibility checks before investing time in paperwork.
To ESRI’s credit, after some follow-up I learned that museum can use the platform, including StoryMaps, for $100 per year (which increases in price as more people in your museum are licensed):
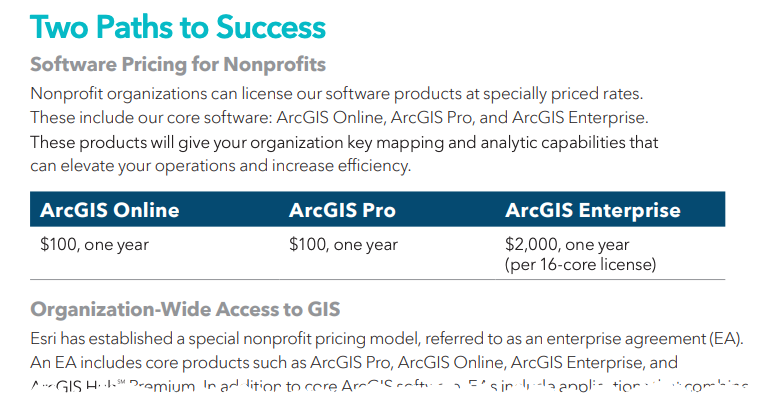
In the meantime, if you want to explore the ESRI applications (including StoryMaps), obtain ArcGIS for Personal Use for $100 per year which is a helpful interim option for testing.
Still, there’s an opportunity here. A clearly posted baseline price for StoryMaps—paired with a straightforward nonprofit or educational discount for museums and historical societies—would make it much easier for organizations to evaluate whether the tool fits their needs and budgets. Greater transparency would likely encourage more experimentation and adoption across the field.
