
 In the 1970s, Bruce Henderson at the Boston Consulting Group (BCG) introduced the “growth-share matrix” to help its clients better manage a portfolio of business units and products. The matrix facilitates management decisions by rating each product according to their share of the market and their potential for growth. Putting each product in one of the four quadrants of the matrix graphically showed which ones were the stars, cash cows, question marks, and pets (cute but worthless). More importantly, it showed the overall position and health of the company and suggested next steps. For example, “cash cows” should be maintained and used to invest in “stars” but “pets” should be abandoned (sorry for offending pet owners, but calling them “dogs” probably won’t make it any easier).
During the past 40 years, the BCG matrix has become a classic tool for business strategy and Harvard Business Review recently named it one of the frameworks that changed the world. Yet it is rarely used by museums and historic sites, who seem to favor the much more limited SWOT exercise. It may be because non-profits are unaware of the matrix but it’s more likely that “market share” and “market growth” are unfamiliar or impracticable concepts. I do like the idea of assessing our work in ways other than attendance and income, so I’ve revised the framework to make it more useful to museums and historic sites.

In this “mission-sustainability matrix,” each public program and activity is assessed according to its current contribution to advancing the organization’s mission and its current ability to be sustainable. “Mission” is a crucial factor but most museums have mission statements that are inadequate for accurately assessing the value of a program or activity. They tend to describe activities (e.g. collect, preserve, and interpret) not goals (i.e., to what end? why?). To clarify that the vertical axis implies a purpose with clear goals, it’s titled, “advances mission and vision.” In the same way, the horizontal axis should be defined broadly–“financial sustainability” includes both earned (e.g., admission fees) and unearned (i.e., donations) revenue that contribute to the programs ability to succeed on its own.
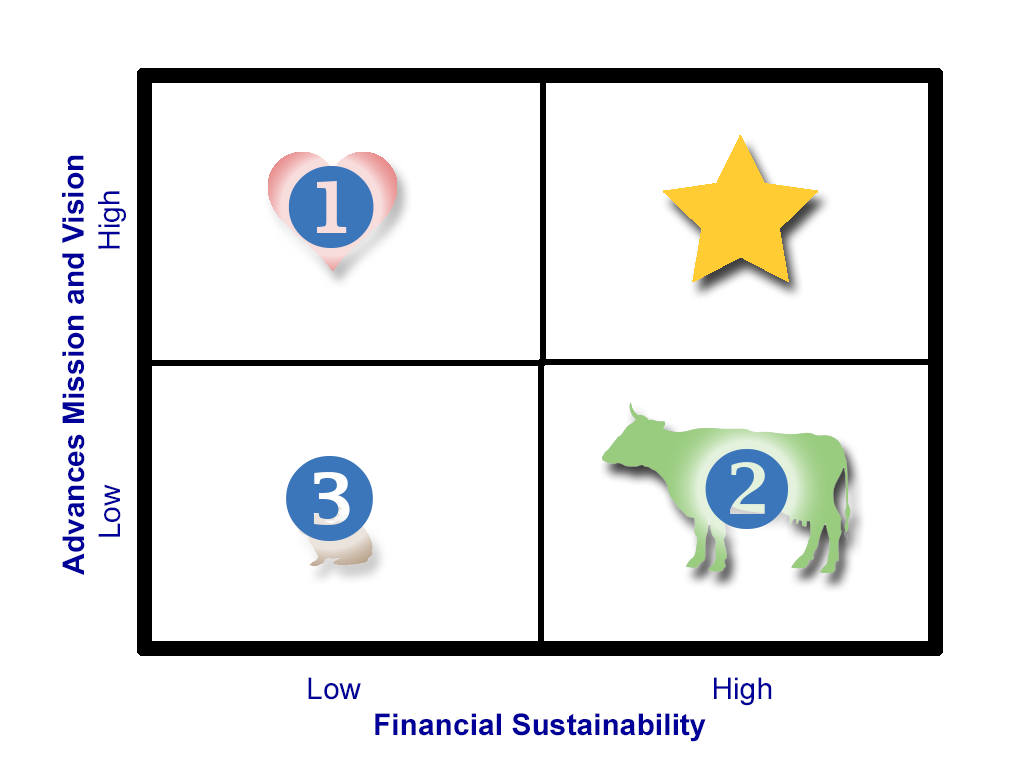 To see how this matrix would be used, let’s imagine an historic site with only three public activities: a school program, a golf tournament, and a garden party. Ideally, each of these programs would fall in the quadrant with the gold star, but that’s not typical. It’s likely that the school program advances the mission but it’s free, so it’s placed in the quadrant with the heart (1). The golf tournament is a big money-maker but has very little to do with the mission, so it’s in the quadrant with the cow (2). The garden party is supposed to be a fundraiser but it actually loses money and although it happens on site, it might as well be at the local country club. It’s a “pet” (3). At a glance you can see the overall configuration of your activities. Although you don’t have any stars, it seems that the school program is balanced by the golf tournament. The next step would be to figure out if either of these programs can be modified to make them into stars. Perhaps a local business would support the school program to make it more financially sustainable? Could the golf tournament help advance the mission in some way? Perhaps each foursome represents a conservation project; if they win, that’s the project that will be taken up next year. The tough decisions are the “pets”–they’re probably someone’s favorite activity but should either be discarded or require more investment to move them into one of the other quadrants.
This framework can easily become more sophisticated by basing the assessments on data rather than anecdote. For example, financial sustainability can be measured according to revenue, expenses, or the number of new members it attracts. A set of outcomes can help assess how well a program advances the mission. Rather than viewing the matrix as only four quadrants, each axis can be a graduated spectrum from low to high so that programs can be placed flexibly on the chart to better understand the relationship among them.
If you’d like to learn more about this approach for managing your museum or historic site, you’ll find the following resources useful or conduct searches using the keywords “social entrepreneurship” or “double bottom line”:
- Desmidt, Sebastian et al. “Looking at the Value of Mission Statements: A Meta-Analysis of 20 Years of Research.” Management Decision 49, no. 3 (2011): 468-483.
- Eccles, Robert and George Serafeim. “Innovating for a Sustainable Strategy.” Harvard Business Review 91, no. 5 (May 2013): 50-60.
- Reeves, Martin et al. “BCG Classics Revisited: The Growth Share Matrix.” BCG Perspectives (June 4, 2014). https://www.bcgperspectives.com/content/articles/corporate_strategy_portfolio_management_strategic_planning_growth_share_matrix_bcg_classics_revisited/
