Tag Archives: Metropolitan Museum of Art

Can I Take a Picture?

Sign at the entrance to the Albuquerque Museum in New Mexico.

What Museum Photography Policies Reveal About Visitor Experiences

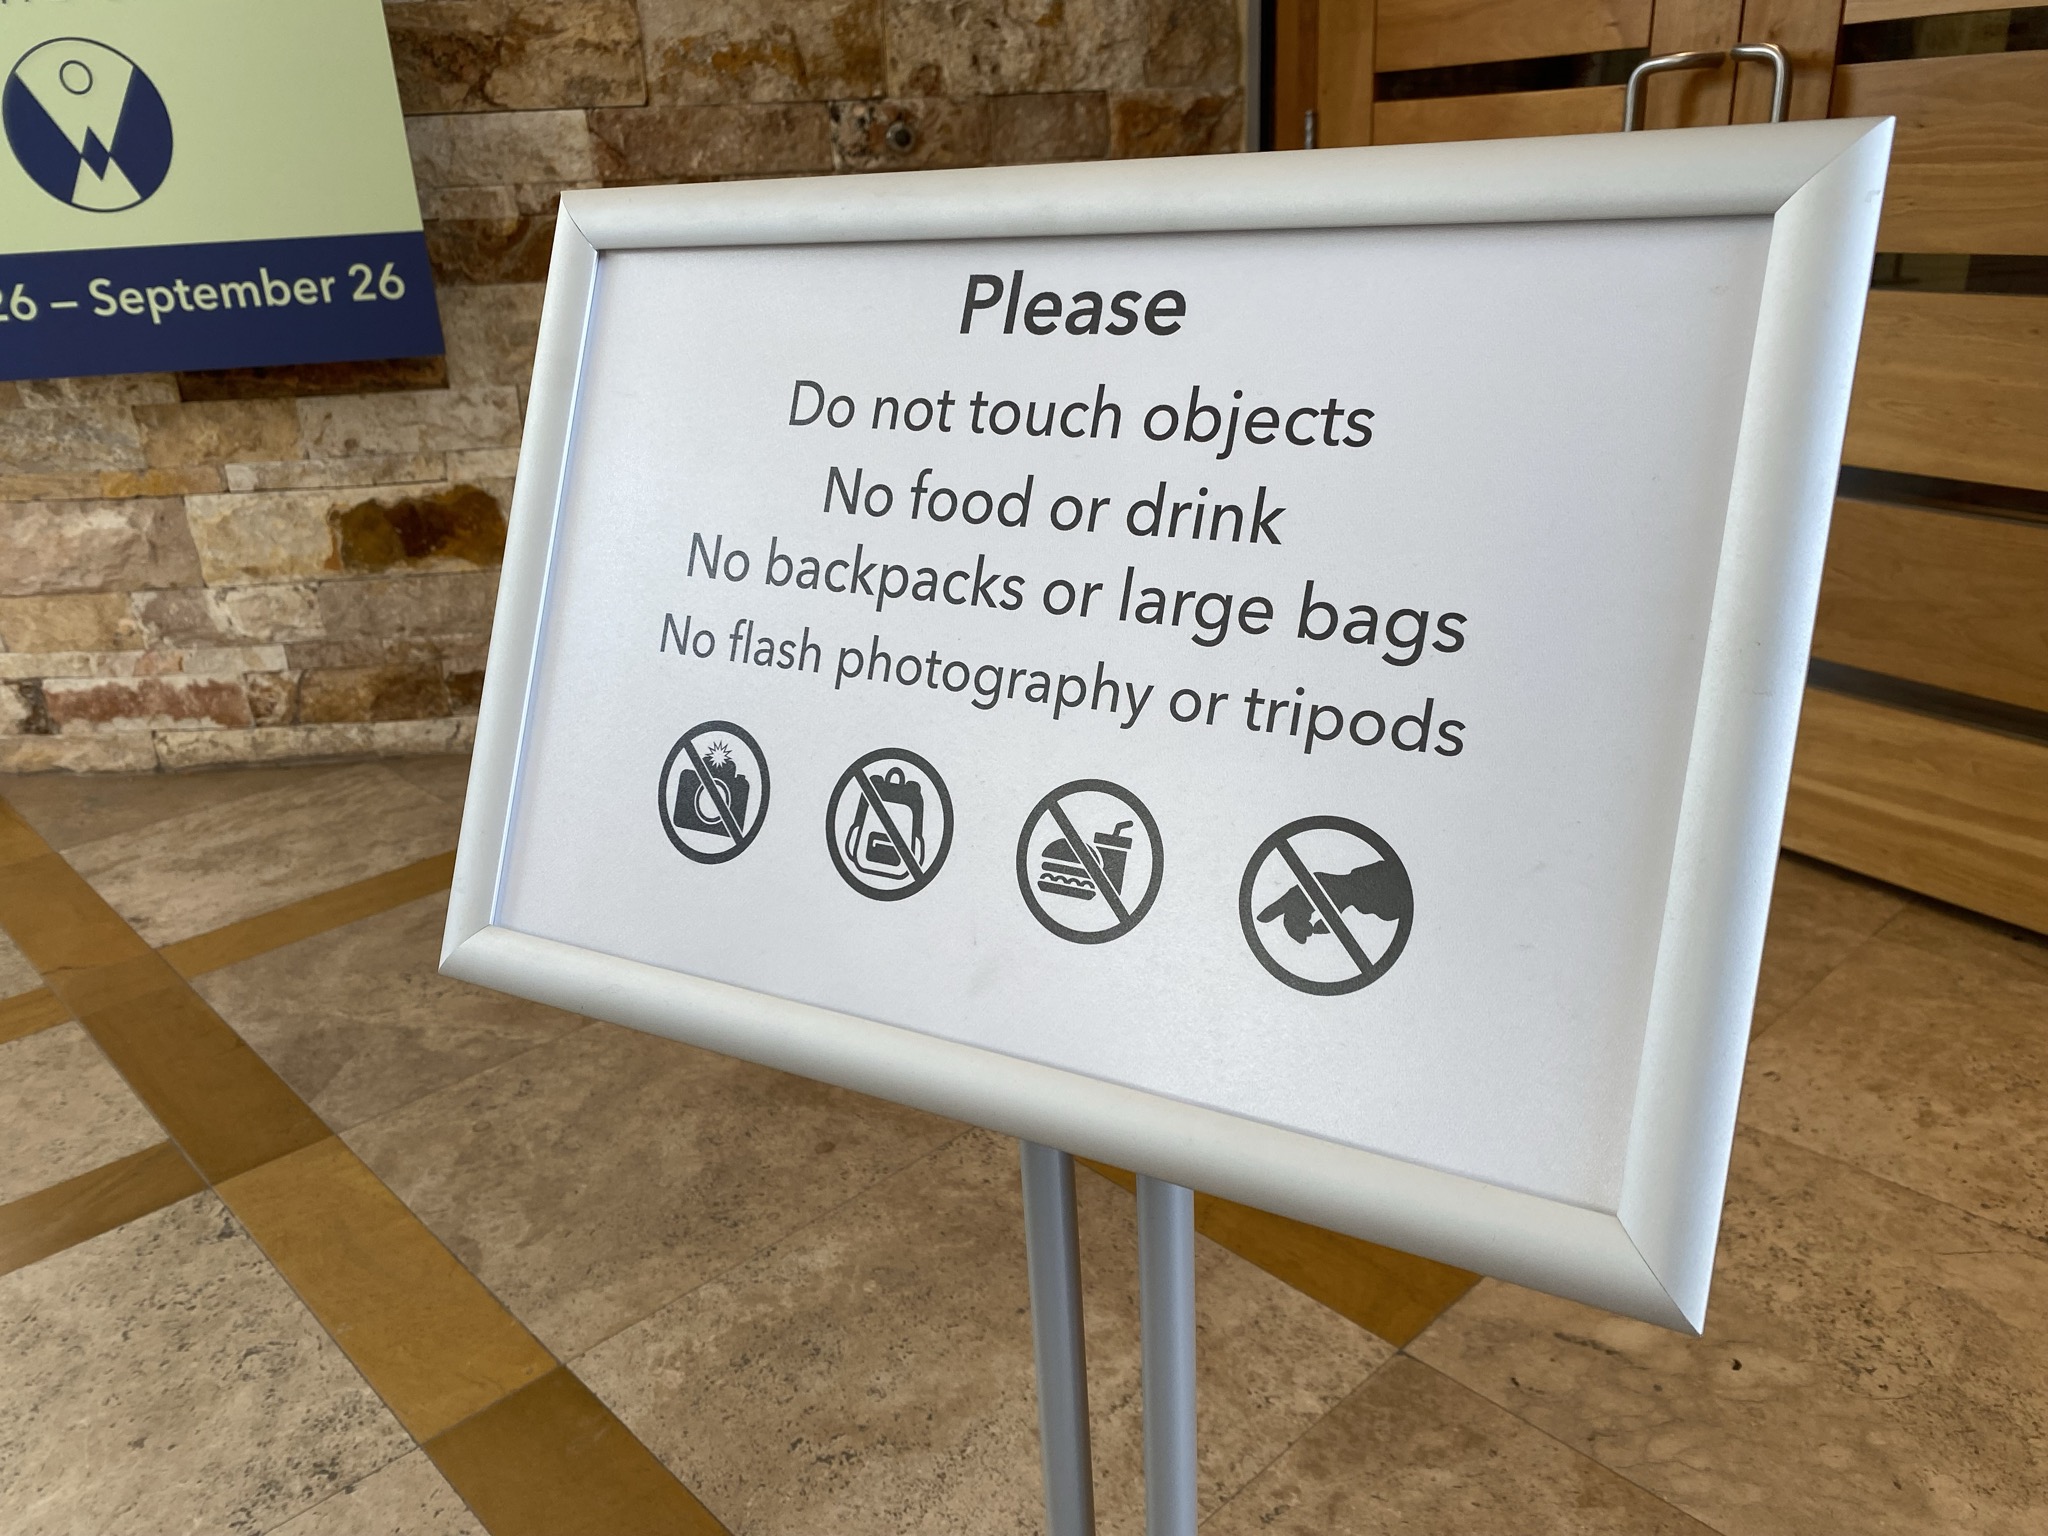
While examining visitor codes of conduct, I started noticing another kind of museum policy that is becoming more visible: photography policies. They appear on websites, ticketing pages, “Know Before You Go” guides, and signs in galleries, historic houses, gardens, and exhibitions. Like codes of conduct, photography policies have always existed in some form, but they now seem more detailed, more prominent, and more complicated.

At first glance, the question seems simple: can visitors take pictures? But museum photography policies reveal that this is no longer a yes-or-no issue. The better question is: what kind of photography, by whom, for what purpose, in what space, and with what effect on collections, staff, visitors, and the experience?

To explore this question, I reviewed photography rules embedded in dozens of visitor codes of conduct and visitor policy pages from museums and historic sites. This was not a scientific or comprehensive study. It was an initial scan of current practice to identify common patterns and management issues. I am not offering legal advice here; museums should consult an attorney on copyright, releases, privacy, and commercial use. My interest is in how these policies shape visitor experience and staff decision-making.

The broad trend is clear: casual, personal photography is increasingly welcomed, but excessive equipment and disruptive, staged, or commercial photography is increasingly controlled.

Continue reading

Met Museum Segmenting Visitors to Improve Its Online Collections

The Metropolitan Museum of Art recently shared the results of its research on the users of its online collections, which approach about 600,000 visitors per month.  Digital analyst Elena Villaespesa collected information on motivations and knowledge through Google Analytics, heat maps, and an online survey to develop six core user segments: professional researchers, student researchers, personal-interest information seekers, inspiration seekers, casual browsers, and visit planners.  This typology will help the museum “plan new content and prioritize production of new features for the online collection” and is a finer version of the “stroller/streaker/scholar” categories that are often used by museum educators.

Using visitor research to plan and design the online collection is good application, but the article also points out several other ideas that will be useful to history museums and historic sites: Continue reading

Million Dollar Salaries at America’s Biggest Museums

Exec Compensation 2011-12A review of the latest Forms 990 of more than two dozen of America’s biggest museums identified the most highly compensated executives in the field.  Among these museums, annual compensation ranged from $228,000 to $1,822,257 and the average was $727,000.  Seven directors earn more than one million dollars per year, as follows:

Financial Management at America’s Billion-Dollar Museums

Big 5 Museums Assets 2012

The Smithsonian Institution has more than $3 billion in assets and had more than $168 million in income for its 2012 fiscal year, making it the biggest and strongest museum in America.  It’s also the leader of the handful of American museums that have more than a billion dollars in net assets, according to the latest financial reports available through GuideStar.  At the top of the list of America’s wealthiest museums are:

  • Smithsonian Institution (Washington, DC)
  • Metropolitan Museum of Art (New York)
  • Museum of Fine Arts Houston (Texas)
  • Colonial Williamsburg Foundation (Virginia)
  • Museum of Modern Art (New York)

This is a nice trivia question for the next museum reception but what does it mean?  First of all, the size of the museum isn’t based on Continue reading

What We Can Learn from America’s Biggest Non-profits?

Philanthropy 400 is the Chronicle of Philanthropy‘s annual list of the 400 groups that raised the most funds from private sources.  For 2011, these groups achieved a median 7.5-percent increase from last year, the third straight year of median gains for non-profits in the Chronicle‘s rankings.  That’s amazing considering the depths of the recession that affected most charities.  “Giving USA” said that charitable giving overall grew less than one percent last year.  About $1 out of every $4 donated by individuals, corporations, and foundations goes to these top 400, so what can we learn from them?

The lessons are a bit hard to uncover given the wide diversity of organizations represented on the list, primarily universities, social services, and health/medical,, followed closely by religious, youth, and education.  Topping the list are: Continue reading